
Advertisement
Saikaya Department Store Co.,Ltd.'s (TSE:8254) 31% Price Boost Is Out Of Tune With Revenues
Saikaya Department Store Co.,Ltd. (TSE:8254) shareholders have had their patience rewarded with a 31% share price jump in the last month. The last 30 days bring the annual gain to a very sharp 45%.
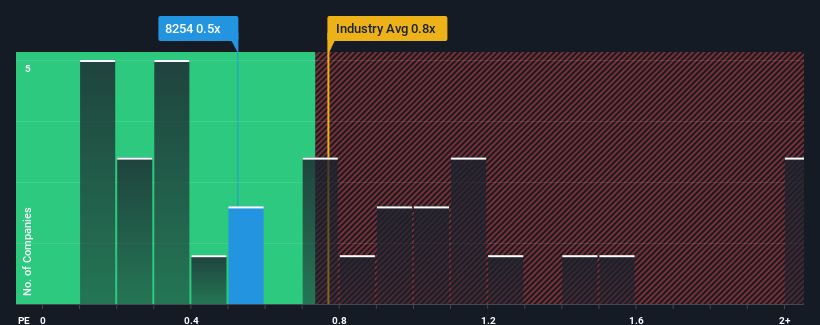
In spite of the firm bounce in price, you could still be forgiven for feeling indifferent about Saikaya Department StoreLtd's P/S ratio of 0.5x, since the median price-to-sales (or "P/S") ratio for the Multiline Retail industry in Japan is also close to 0.8x. However, investors might be overlooking a clear opportunity or potential setback if there is no rational basis for the P/S.
View our latest analysis for Saikaya Department StoreLtd
What Does Saikaya Department StoreLtd's Recent Performance Look Like?
As an illustration, revenue has deteriorated at Saikaya Department StoreLtd over the last year, which is not ideal at all. One possibility is that the P/S is moderate because investors think the company might still do enough to be in line with the broader industry in the near future. If you like the company, you'd at least be hoping this is the case so that you could potentially pick up some stock while it's not quite in favour.
Want the full picture on earnings, revenue and cash flow for the company? Then our free report on Saikaya Department StoreLtd will help you shine a light on its historical performance.Is There Some Revenue Growth Forecasted For Saikaya Department StoreLtd?
There's an inherent assumption that a company should be matching the industry for P/S ratios like Saikaya Department StoreLtd's to be considered reasonable.
In reviewing the last year of financials, we were disheartened to see the company's revenues fell to the tune of 19%. The last three years don't look nice either as the company has shrunk revenue by 67% in aggregate. Therefore, it's fair to say the revenue growth recently has been undesirable for the company.
Weighing that medium-term revenue trajectory against the broader industry's one-year forecast for expansion of 7.3% shows it's an unpleasant look.
With this information, we find it concerning that Saikaya Department StoreLtd is trading at a fairly similar P/S compared to the industry. Apparently many investors in the company are way less bearish than recent times would indicate and aren't willing to let go of their stock right now. Only the boldest would assume these prices are sustainable as a continuation of recent revenue trends is likely to weigh on the share price eventually.
The Bottom Line On Saikaya Department StoreLtd's P/S
Its shares have lifted substantially and now Saikaya Department StoreLtd's P/S is back within range of the industry median. It's argued the price-to-sales ratio is an inferior measure of value within certain industries, but it can be a powerful business sentiment indicator.
Our look at Saikaya Department StoreLtd revealed its shrinking revenues over the medium-term haven't impacted the P/S as much as we anticipated, given the industry is set to grow. Even though it matches the industry, we're uncomfortable with the current P/S ratio, as this dismal revenue performance is unlikely to support a more positive sentiment for long. Unless the the circumstances surrounding the recent medium-term improve, it wouldn't be wrong to expect a a difficult period ahead for the company's shareholders.
Having said that, be aware Saikaya Department StoreLtd is showing 2 warning signs in our investment analysis, and 1 of those is a bit concerning.
If strong companies turning a profit tickle your fancy, then you'll want to check out this free list of interesting companies that trade on a low P/E (but have proven they can grow earnings).
New: Manage All Your Stock Portfolios in One Place
We've created the ultimate portfolio companion for stock investors, and it's free.
• Connect an unlimited number of Portfolios and see your total in one currency
• Be alerted to new Warning Signs or Risks via email or mobile
• Track the Fair Value of your stocks
Have feedback on this article? Concerned about the content? Get in touch with us directly. Alternatively, email editorial-team (at) simplywallst.com.
This article by Simply Wall St is general in nature. We provide commentary based on historical data and analyst forecasts only using an unbiased methodology and our articles are not intended to be financial advice. It does not constitute a recommendation to buy or sell any stock, and does not take account of your objectives, or your financial situation. We aim to bring you long-term focused analysis driven by fundamental data. Note that our analysis may not factor in the latest price-sensitive company announcements or qualitative material. Simply Wall St has no position in any stocks mentioned.
About TSE:8254
Fair value with questionable track record.
Market Insights

Advertisement
Community Narratives
Groundbreaking therapies that could change the treatment landscape for PTSD, fibromyalgia, MS & Alzheimer’s
Fair Value US$6.20|86.9% undervalued
CM
Community Contributor
DigitalOcean Will Grow 14% by Embracing AI with Paperspace Acquisition
Fair Value US$50.00|42.8% undervalued
NE
Community Contributor
Viant Technology: A Rising AdTech Challenger in the AI-Powered CTV Market
Fair Value US$38.61|66.0% undervalued
BL
Community Contributor
Volvo will Accelerate Forward into Electric and Autonomous Leadership in Five Years
Fair Value SEK 438.80|40.1% undervalued
UN
Community Contributor