
Advertisement
The external fund manager backed by Berkshire Hathaway's Charlie Munger, Li Lu, makes no bones about it when he says 'The biggest investment risk is not the volatility of prices, but whether you will suffer a permanent loss of capital.' When we think about how risky a company is, we always like to look at its use of debt, since debt overload can lead to ruin. Importantly, Workman Co.,Ltd. (TSE:7564) does carry debt. But the real question is whether this debt is making the company risky.
Why Does Debt Bring Risk?
Debt and other liabilities become risky for a business when it cannot easily fulfill those obligations, either with free cash flow or by raising capital at an attractive price. Ultimately, if the company can't fulfill its legal obligations to repay debt, shareholders could walk away with nothing. However, a more frequent (but still costly) occurrence is where a company must issue shares at bargain-basement prices, permanently diluting shareholders, just to shore up its balance sheet. Of course, debt can be an important tool in businesses, particularly capital heavy businesses. The first thing to do when considering how much debt a business uses is to look at its cash and debt together.
Check out our latest analysis for WorkmanLtd
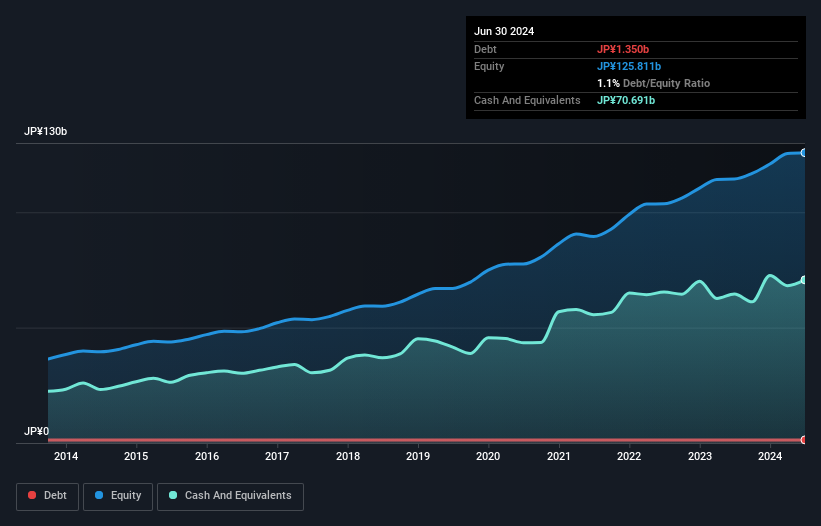
What Is WorkmanLtd's Net Debt?
The chart below, which you can click on for greater detail, shows that WorkmanLtd had JP¥1.35b in debt in June 2024; about the same as the year before. However, it does have JP¥70.7b in cash offsetting this, leading to net cash of JP¥69.3b.
A Look At WorkmanLtd's Liabilities
Zooming in on the latest balance sheet data, we can see that WorkmanLtd had liabilities of JP¥16.1b due within 12 months and liabilities of JP¥4.65b due beyond that. On the other hand, it had cash of JP¥70.7b and JP¥18.4b worth of receivables due within a year. So it can boast JP¥68.4b more liquid assets than total liabilities.
This excess liquidity suggests that WorkmanLtd is taking a careful approach to debt. Due to its strong net asset position, it is not likely to face issues with its lenders. Simply put, the fact that WorkmanLtd has more cash than debt is arguably a good indication that it can manage its debt safely.
But the other side of the story is that WorkmanLtd saw its EBIT decline by 2.9% over the last year. If earnings continue to decline at that rate the company may have increasing difficulty managing its debt load. There's no doubt that we learn most about debt from the balance sheet. But it is future earnings, more than anything, that will determine WorkmanLtd's ability to maintain a healthy balance sheet going forward. So if you're focused on the future you can check out this free report showing analyst profit forecasts.
Finally, while the tax-man may adore accounting profits, lenders only accept cold hard cash. While WorkmanLtd has net cash on its balance sheet, it's still worth taking a look at its ability to convert earnings before interest and tax (EBIT) to free cash flow, to help us understand how quickly it is building (or eroding) that cash balance. In the last three years, WorkmanLtd's free cash flow amounted to 37% of its EBIT, less than we'd expect. That's not great, when it comes to paying down debt.
Summing Up
While it is always sensible to investigate a company's debt, in this case WorkmanLtd has JP¥69.3b in net cash and a decent-looking balance sheet. So we are not troubled with WorkmanLtd's debt use. Over time, share prices tend to follow earnings per share, so if you're interested in WorkmanLtd, you may well want to click here to check an interactive graph of its earnings per share history.
Of course, if you're the type of investor who prefers buying stocks without the burden of debt, then don't hesitate to discover our exclusive list of net cash growth stocks, today.
Valuation is complex, but we're here to simplify it.
Discover if WorkmanLtd might be undervalued or overvalued with our detailed analysis, featuring fair value estimates, potential risks, dividends, insider trades, and its financial condition.
Access Free AnalysisHave feedback on this article? Concerned about the content? Get in touch with us directly. Alternatively, email editorial-team (at) simplywallst.com.
This article by Simply Wall St is general in nature. We provide commentary based on historical data and analyst forecasts only using an unbiased methodology and our articles are not intended to be financial advice. It does not constitute a recommendation to buy or sell any stock, and does not take account of your objectives, or your financial situation. We aim to bring you long-term focused analysis driven by fundamental data. Note that our analysis may not factor in the latest price-sensitive company announcements or qualitative material. Simply Wall St has no position in any stocks mentioned.
About TSE:7564
Flawless balance sheet with solid track record.
Market Insights

Advertisement
Community Narratives
MicroVision will explode future revenue by 380.37% with a vision towards success
Fair Value US$60.00|98.4% undervalued
TH
Community Contributor
The Indispensable Artery for a New North American Economy
Fair Value CA$132.87|1.3% undervalued
TI
Community Contributor