
Advertisement
Pan Pacific International Holdings Corporation's (TSE:7532) Stock Is Going Strong: Is the Market Following Fundamentals?

Most readers would already be aware that Pan Pacific International Holdings' (TSE:7532) stock increased significantly by 7.5% over the past month. Given that the market rewards strong financials in the long-term, we wonder if that is the case in this instance. In this article, we decided to focus on Pan Pacific International Holdings' ROE.
Return on Equity or ROE is a test of how effectively a company is growing its value and managing investors’ money. In short, ROE shows the profit each dollar generates with respect to its shareholder investments.
We check all companies for important risks. See what we found for Pan Pacific International Holdings in our free report.How Do You Calculate Return On Equity?
The formula for ROE is:
Return on Equity = Net Profit (from continuing operations) ÷ Shareholders' Equity
So, based on the above formula, the ROE for Pan Pacific International Holdings is:
16% = JP¥93b ÷ JP¥584b (Based on the trailing twelve months to December 2024).
The 'return' is the amount earned after tax over the last twelve months. That means that for every ¥1 worth of shareholders' equity, the company generated ¥0.16 in profit.
See our latest analysis for Pan Pacific International Holdings
Why Is ROE Important For Earnings Growth?
So far, we've learned that ROE is a measure of a company's profitability. Based on how much of its profits the company chooses to reinvest or "retain", we are then able to evaluate a company's future ability to generate profits. Assuming everything else remains unchanged, the higher the ROE and profit retention, the higher the growth rate of a company compared to companies that don't necessarily bear these characteristics.
Pan Pacific International Holdings' Earnings Growth And 16% ROE
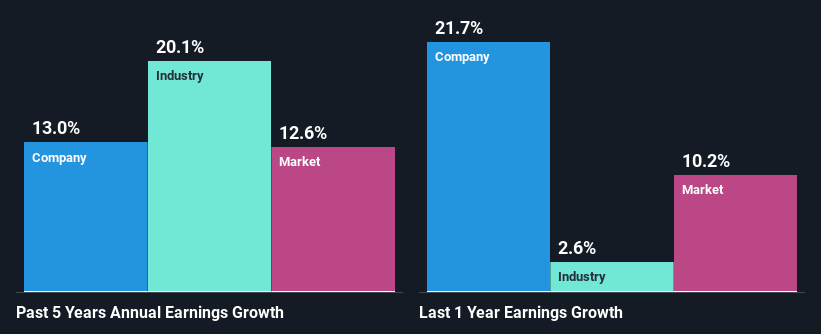
To begin with, Pan Pacific International Holdings seems to have a respectable ROE. Especially when compared to the industry average of 10.0% the company's ROE looks pretty impressive. This probably laid the ground for Pan Pacific International Holdings' moderate 13% net income growth seen over the past five years.
As a next step, we compared Pan Pacific International Holdings' net income growth with the industry and were disappointed to see that the company's growth is lower than the industry average growth of 20% in the same period.
Earnings growth is a huge factor in stock valuation. The investor should try to establish if the expected growth or decline in earnings, whichever the case may be, is priced in. Doing so will help them establish if the stock's future looks promising or ominous. If you're wondering about Pan Pacific International Holdings''s valuation, check out this gauge of its price-to-earnings ratio, as compared to its industry.
Is Pan Pacific International Holdings Making Efficient Use Of Its Profits?
Pan Pacific International Holdings has a low three-year median payout ratio of 16%, meaning that the company retains the remaining 84% of its profits. This suggests that the management is reinvesting most of the profits to grow the business.
Additionally, Pan Pacific International Holdings has paid dividends over a period of at least ten years which means that the company is pretty serious about sharing its profits with shareholders.
Summary
In total, we are pretty happy with Pan Pacific International Holdings' performance. Specifically, we like that the company is reinvesting a huge chunk of its profits at a high rate of return. This of course has caused the company to see a good amount of growth in its earnings. Having said that, the company's earnings growth is expected to slow down, as forecasted in the current analyst estimates. To know more about the latest analysts predictions for the company, check out this visualization of analyst forecasts for the company.
New: Manage All Your Stock Portfolios in One Place
We've created the ultimate portfolio companion for stock investors, and it's free.
• Connect an unlimited number of Portfolios and see your total in one currency
• Be alerted to new Warning Signs or Risks via email or mobile
• Track the Fair Value of your stocks
Have feedback on this article? Concerned about the content? Get in touch with us directly. Alternatively, email editorial-team (at) simplywallst.com.
This article by Simply Wall St is general in nature. We provide commentary based on historical data and analyst forecasts only using an unbiased methodology and our articles are not intended to be financial advice. It does not constitute a recommendation to buy or sell any stock, and does not take account of your objectives, or your financial situation. We aim to bring you long-term focused analysis driven by fundamental data. Note that our analysis may not factor in the latest price-sensitive company announcements or qualitative material. Simply Wall St has no position in any stocks mentioned.
About TSE:7532
Flawless balance sheet with solid track record.
Similar Companies
Market Insights

Advertisement
Community Narratives

BMW cruising ahead with new EVs and premium models to boost revenue 5%
Fair Value €135.07|44.5% undervalued
UN
Community Contributor
EU#2 - From Humble Beginnings to Global Powerhouse
Fair Value DKK 851.04|46.1% undervalued
TO
Community Contributor