
Advertisement

David Iben put it well when he said, 'Volatility is not a risk we care about. What we care about is avoiding the permanent loss of capital.' It's only natural to consider a company's balance sheet when you examine how risky it is, since debt is often involved when a business collapses. As with many other companies TORICO Co., Ltd. (TSE:7138) makes use of debt. But should shareholders be worried about its use of debt?
Why Does Debt Bring Risk?
Debt is a tool to help businesses grow, but if a business is incapable of paying off its lenders, then it exists at their mercy. If things get really bad, the lenders can take control of the business. However, a more common (but still painful) scenario is that it has to raise new equity capital at a low price, thus permanently diluting shareholders. Of course, debt can be an important tool in businesses, particularly capital heavy businesses. When we examine debt levels, we first consider both cash and debt levels, together.
How Much Debt Does TORICO Carry?
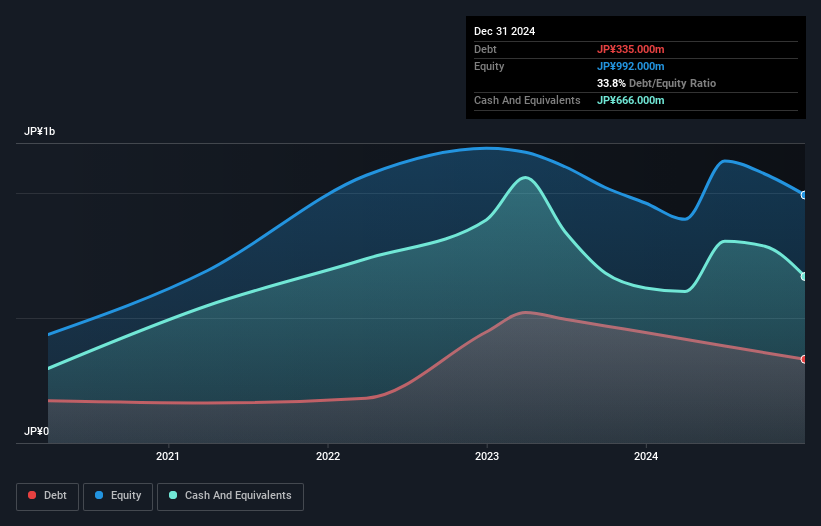
The image below, which you can click on for greater detail, shows that TORICO had debt of JP¥335.0m at the end of December 2024, a reduction from JP¥442.0m over a year. But it also has JP¥666.0m in cash to offset that, meaning it has JP¥331.0m net cash.
A Look At TORICO's Liabilities
The latest balance sheet data shows that TORICO had liabilities of JP¥681.0m due within a year, and liabilities of JP¥194.0m falling due after that. Offsetting this, it had JP¥666.0m in cash and JP¥335.0m in receivables that were due within 12 months. So it actually has JP¥126.0m more liquid assets than total liabilities.
This surplus suggests that TORICO has a conservative balance sheet, and could probably eliminate its debt without much difficulty. Simply put, the fact that TORICO has more cash than debt is arguably a good indication that it can manage its debt safely. The balance sheet is clearly the area to focus on when you are analysing debt. But you can't view debt in total isolation; since TORICO will need earnings to service that debt. So if you're keen to discover more about its earnings, it might be worth checking out this graph of its long term earnings trend .
Check out our latest analysis for TORICO
In the last year TORICO had a loss before interest and tax, and actually shrunk its revenue by 7.6%, to JP¥3.9b. We would much prefer see growth.
So How Risky Is TORICO?
Statistically speaking companies that lose money are riskier than those that make money. And the fact is that over the last twelve months TORICO lost money at the earnings before interest and tax (EBIT) line. And over the same period it saw negative free cash outflow of JP¥99m and booked a JP¥287m accounting loss. While this does make the company a bit risky, it's important to remember it has net cash of JP¥331.0m. That kitty means the company can keep spending for growth for at least two years, at current rates. Overall, its balance sheet doesn't seem overly risky, at the moment, but we're always cautious until we see the positive free cash flow. The balance sheet is clearly the area to focus on when you are analysing debt. But ultimately, every company can contain risks that exist outside of the balance sheet. For instance, we've identified 3 warning signs for TORICO (2 are significant) you should be aware of.
Of course, if you're the type of investor who prefers buying stocks without the burden of debt, then don't hesitate to discover our exclusive list of net cash growth stocks, today.
Valuation is complex, but we're here to simplify it.
Discover if TORICO might be undervalued or overvalued with our detailed analysis, featuring fair value estimates, potential risks, dividends, insider trades, and its financial condition.
Access Free AnalysisHave feedback on this article? Concerned about the content? Get in touch with us directly. Alternatively, email editorial-team (at) simplywallst.com.
This article by Simply Wall St is general in nature. We provide commentary based on historical data and analyst forecasts only using an unbiased methodology and our articles are not intended to be financial advice. It does not constitute a recommendation to buy or sell any stock, and does not take account of your objectives, or your financial situation. We aim to bring you long-term focused analysis driven by fundamental data. Note that our analysis may not factor in the latest price-sensitive company announcements or qualitative material. Simply Wall St has no position in any stocks mentioned.
About TSE:7138
Flawless balance sheet low.
Market Insights


Advertisement
Community Narratives
The Future of Drug Testing? Fingerprint Tech Shows Serious Promise
Fair Value US$2.98|40.3% undervalued
JO
Community Contributor
Suncorp’s Next Chapter: Insurance-Only and Ready to Grow
Fair Value AU$22.83|7.9% undervalued
RO
Community Contributor
Thyssenkrupp Nucera Will Achieve Double-Digit Profits by 2030 Boosted by Hydrogen Growth
Fair Value €14.40|31.6% undervalued
CH
Community Contributor
Tesla’s Nvidia Moment – The AI & Robotics Inflection Point
Fair Value US$359.72|12.3% undervalued
BL
Community Contributor