
Advertisement
Some say volatility, rather than debt, is the best way to think about risk as an investor, but Warren Buffett famously said that 'Volatility is far from synonymous with risk.' When we think about how risky a company is, we always like to look at its use of debt, since debt overload can lead to ruin. As with many other companies USS Co., Ltd. (TSE:4732) makes use of debt. But should shareholders be worried about its use of debt?
What Risk Does Debt Bring?
Generally speaking, debt only becomes a real problem when a company can't easily pay it off, either by raising capital or with its own cash flow. Part and parcel of capitalism is the process of 'creative destruction' where failed businesses are mercilessly liquidated by their bankers. However, a more common (but still painful) scenario is that it has to raise new equity capital at a low price, thus permanently diluting shareholders. Of course, plenty of companies use debt to fund growth, without any negative consequences. When we examine debt levels, we first consider both cash and debt levels, together.
How Much Debt Does USS Carry?
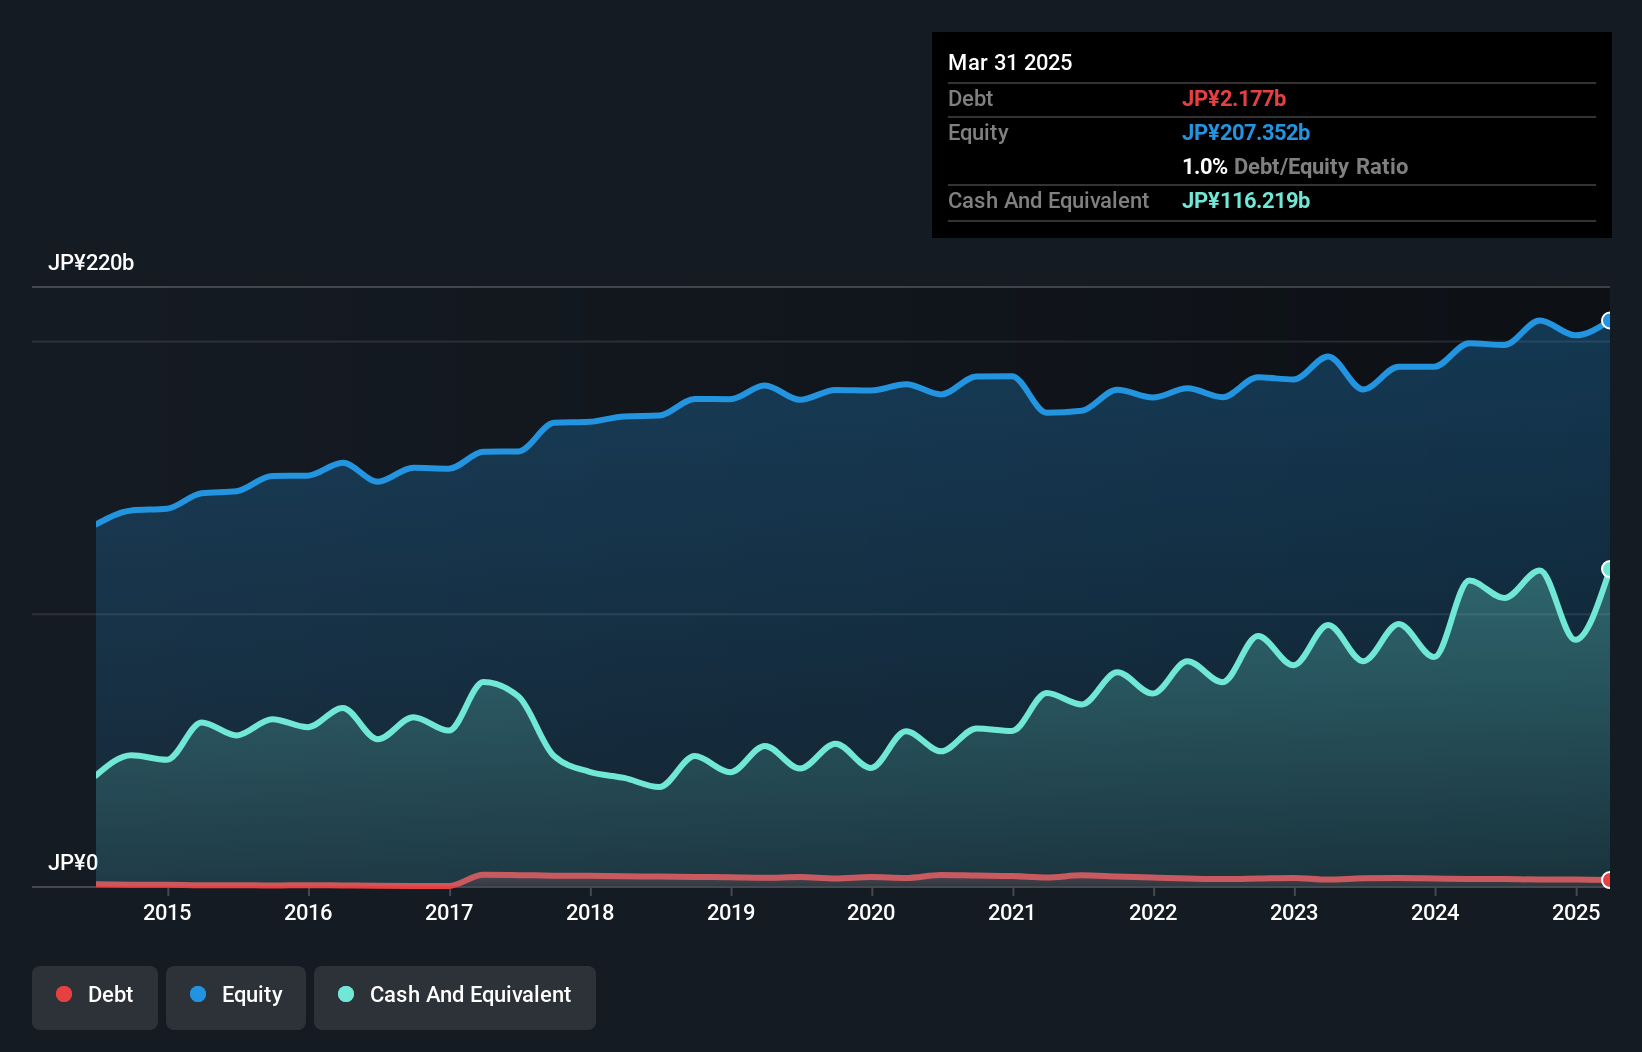
You can click the graphic below for the historical numbers, but it shows that USS had JP¥2.18b of debt in March 2025, down from JP¥2.59b, one year before. But it also has JP¥116.2b in cash to offset that, meaning it has JP¥114.0b net cash.
How Healthy Is USS' Balance Sheet?
According to the last reported balance sheet, USS had liabilities of JP¥51.2b due within 12 months, and liabilities of JP¥8.85b due beyond 12 months. Offsetting this, it had JP¥116.2b in cash and JP¥24.8b in receivables that were due within 12 months. So it can boast JP¥81.0b more liquid assets than total liabilities.
This surplus suggests that USS has a conservative balance sheet, and could probably eliminate its debt without much difficulty. Simply put, the fact that USS has more cash than debt is arguably a good indication that it can manage its debt safely.
See our latest analysis for USS
Also good is that USS grew its EBIT at 10% over the last year, further increasing its ability to manage debt. When analysing debt levels, the balance sheet is the obvious place to start. But ultimately the future profitability of the business will decide if USS can strengthen its balance sheet over time. So if you're focused on the future you can check out this free report showing analyst profit forecasts.
But our final consideration is also important, because a company cannot pay debt with paper profits; it needs cold hard cash. USS may have net cash on the balance sheet, but it is still interesting to look at how well the business converts its earnings before interest and tax (EBIT) to free cash flow, because that will influence both its need for, and its capacity to manage debt. During the last three years, USS produced sturdy free cash flow equating to 75% of its EBIT, about what we'd expect. This cold hard cash means it can reduce its debt when it wants to.

Summing Up
While we empathize with investors who find debt concerning, you should keep in mind that USS has net cash of JP¥114.0b, as well as more liquid assets than liabilities. And it impressed us with free cash flow of JP¥34b, being 75% of its EBIT. So is USS's debt a risk? It doesn't seem so to us. Another positive for shareholders is that it pays dividends. So if you like receiving those dividend payments, check USS's dividend history, without delay!
If, after all that, you're more interested in a fast growing company with a rock-solid balance sheet, then check out our list of net cash growth stocks without delay.
New: AI Stock Screener & Alerts
Our new AI Stock Screener scans the market every day to uncover opportunities.
• Dividend Powerhouses (3%+ Yield)
• Undervalued Small Caps with Insider Buying
• High growth Tech and AI Companies
Or build your own from over 50 metrics.
Have feedback on this article? Concerned about the content? Get in touch with us directly. Alternatively, email editorial-team (at) simplywallst.com.
This article by Simply Wall St is general in nature. We provide commentary based on historical data and analyst forecasts only using an unbiased methodology and our articles are not intended to be financial advice. It does not constitute a recommendation to buy or sell any stock, and does not take account of your objectives, or your financial situation. We aim to bring you long-term focused analysis driven by fundamental data. Note that our analysis may not factor in the latest price-sensitive company announcements or qualitative material. Simply Wall St has no position in any stocks mentioned.
About TSE:4732
Flawless balance sheet established dividend payer.
Market Insights

Advertisement
Community Narratives
MicroVision will explode future revenue by 380.37% with a vision towards success
Fair Value US$60.00|98.4% undervalued
TH
Community Contributor
The Indispensable Artery for a New North American Economy
Fair Value CA$132.87|1.3% undervalued
TI
Community Contributor