- Japan
- /
- Specialty Stores
- /
- TSE:3135
Further Upside For MarketEnterprise Co.,Ltd (TSE:3135) Shares Could Introduce Price Risks After 31% Bounce


MarketEnterprise Co.,Ltd (TSE:3135) shareholders are no doubt pleased to see that the share price has bounced 31% in the last month, although it is still struggling to make up recently lost ground. The annual gain comes to 102% following the latest surge, making investors sit up and take notice.
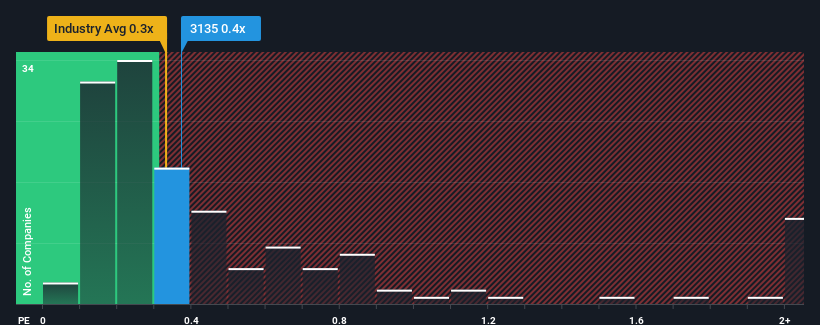
Although its price has surged higher, it's still not a stretch to say that MarketEnterpriseLtd's price-to-sales (or "P/S") ratio of 0.4x right now seems quite "middle-of-the-road" compared to the Specialty Retail industry in Japan, where the median P/S ratio is around 0.3x. Although, it's not wise to simply ignore the P/S without explanation as investors may be disregarding a distinct opportunity or a costly mistake.
We've discovered 3 warning signs about MarketEnterpriseLtd. View them for free.View our latest analysis for MarketEnterpriseLtd
How Has MarketEnterpriseLtd Performed Recently?
Recent times have been quite advantageous for MarketEnterpriseLtd as its revenue has been rising very briskly. The P/S is probably moderate because investors think this strong revenue growth might not be enough to outperform the broader industry in the near future. If that doesn't eventuate, then existing shareholders have reason to be feeling optimistic about the future direction of the share price.
Want the full picture on earnings, revenue and cash flow for the company? Then our free report on MarketEnterpriseLtd will help you shine a light on its historical performance.What Are Revenue Growth Metrics Telling Us About The P/S?
There's an inherent assumption that a company should be matching the industry for P/S ratios like MarketEnterpriseLtd's to be considered reasonable.
If we review the last year of revenue growth, the company posted a terrific increase of 34%. The latest three year period has also seen an excellent 104% overall rise in revenue, aided by its short-term performance. Accordingly, shareholders would have definitely welcomed those medium-term rates of revenue growth.
Comparing that to the industry, which is only predicted to deliver 7.2% growth in the next 12 months, the company's momentum is stronger based on recent medium-term annualised revenue results.
With this information, we find it interesting that MarketEnterpriseLtd is trading at a fairly similar P/S compared to the industry. It may be that most investors are not convinced the company can maintain its recent growth rates.
What We Can Learn From MarketEnterpriseLtd's P/S?
Its shares have lifted substantially and now MarketEnterpriseLtd's P/S is back within range of the industry median. Using the price-to-sales ratio alone to determine if you should sell your stock isn't sensible, however it can be a practical guide to the company's future prospects.
We didn't quite envision MarketEnterpriseLtd's P/S sitting in line with the wider industry, considering the revenue growth over the last three-year is higher than the current industry outlook. It'd be fair to assume that potential risks the company faces could be the contributing factor to the lower than expected P/S. At least the risk of a price drop looks to be subdued if recent medium-term revenue trends continue, but investors seem to think future revenue could see some volatility.
There are also other vital risk factors to consider and we've discovered 3 warning signs for MarketEnterpriseLtd (1 is significant!) that you should be aware of before investing here.
If these risks are making you reconsider your opinion on MarketEnterpriseLtd, explore our interactive list of high quality stocks to get an idea of what else is out there.
New: Manage All Your Stock Portfolios in One Place
We've created the ultimate portfolio companion for stock investors, and it's free.
• Connect an unlimited number of Portfolios and see your total in one currency
• Be alerted to new Warning Signs or Risks via email or mobile
• Track the Fair Value of your stocks
Have feedback on this article? Concerned about the content? Get in touch with us directly. Alternatively, email editorial-team (at) simplywallst.com.
This article by Simply Wall St is general in nature. We provide commentary based on historical data and analyst forecasts only using an unbiased methodology and our articles are not intended to be financial advice. It does not constitute a recommendation to buy or sell any stock, and does not take account of your objectives, or your financial situation. We aim to bring you long-term focused analysis driven by fundamental data. Note that our analysis may not factor in the latest price-sensitive company announcements or qualitative material. Simply Wall St has no position in any stocks mentioned.
About TSE:3135
Acceptable track record with mediocre balance sheet.
Market Insights

Community Narratives

