Advertisement
- Japan
- /
- Specialty Stores
- /
- TSE:3046
Evaluating JINS HOLDINGS (TSE:3046) Valuation Following Strong September Sales Growth

Simply Wall St
Reviewed by Kshitija Bhandaru
JINS HOLDINGS (TSE:3046) just shared its preliminary September sales figures, revealing a 12% rise in total sales for its Japanese eyewear stores. Same-store sales also moved higher and climbed 8% year-over-year during the month.
See our latest analysis for JINS HOLDINGS.
JINS HOLDINGS’ upbeat September sales report comes after strong share price momentum this year, with the stock up more than 34% year-to-date and a remarkable 67% total shareholder return over the past twelve months. This surge suggests investors are increasingly optimistic about the company’s growth prospects and recent execution, even after some pullback in the past month.
With market momentum shifting, it’s worth expanding your search and discovering fast growing stocks with high insider ownership.
With such strong growth and upbeat investor sentiment already reflected in the share price, the key question now is whether JINS HOLDINGS is undervalued or if the market has already priced in further gains. Could this be a true buying opportunity?Price-to-Earnings of 25.6x: Is it justified?
JINS HOLDINGS is trading at a price-to-earnings (P/E) ratio of 25.6x, which places its valuation well above both its peer average (16.5x) and the broader JP Specialty Retail industry average (14.2x). The last close price of ¥8,540 suggests the market is pricing in strong future performance, but also signals investors may be willing to pay a premium.
The price-to-earnings ratio reflects how much investors are willing to pay for each yen of current earnings. High P/E multiples can indicate optimism about growth and profitability, especially for companies that have rapidly improved profitability or are forecasting further earnings gains.
In the case of JINS HOLDINGS, the market is paying a markedly higher multiple than both its direct rivals and the average peer group. Not only is the stock more expensive than industry norms, but its P/E ratio also exceeds its estimated fair Price-to-Earnings Ratio of 19.7x. This could be a level the market may gravitate toward if sentiment or outlook cools.
Explore the SWS fair ratio for JINS HOLDINGS
Result: Price-to-Earnings of 25.6x (OVERVALUED)
However, any slowdown in revenue growth or a dip in profit margins could quickly temper investor enthusiasm and put pressure on the elevated valuation.
Find out about the key risks to this JINS HOLDINGS narrative.
Another View: The SWS DCF Model Suggests Undervaluation
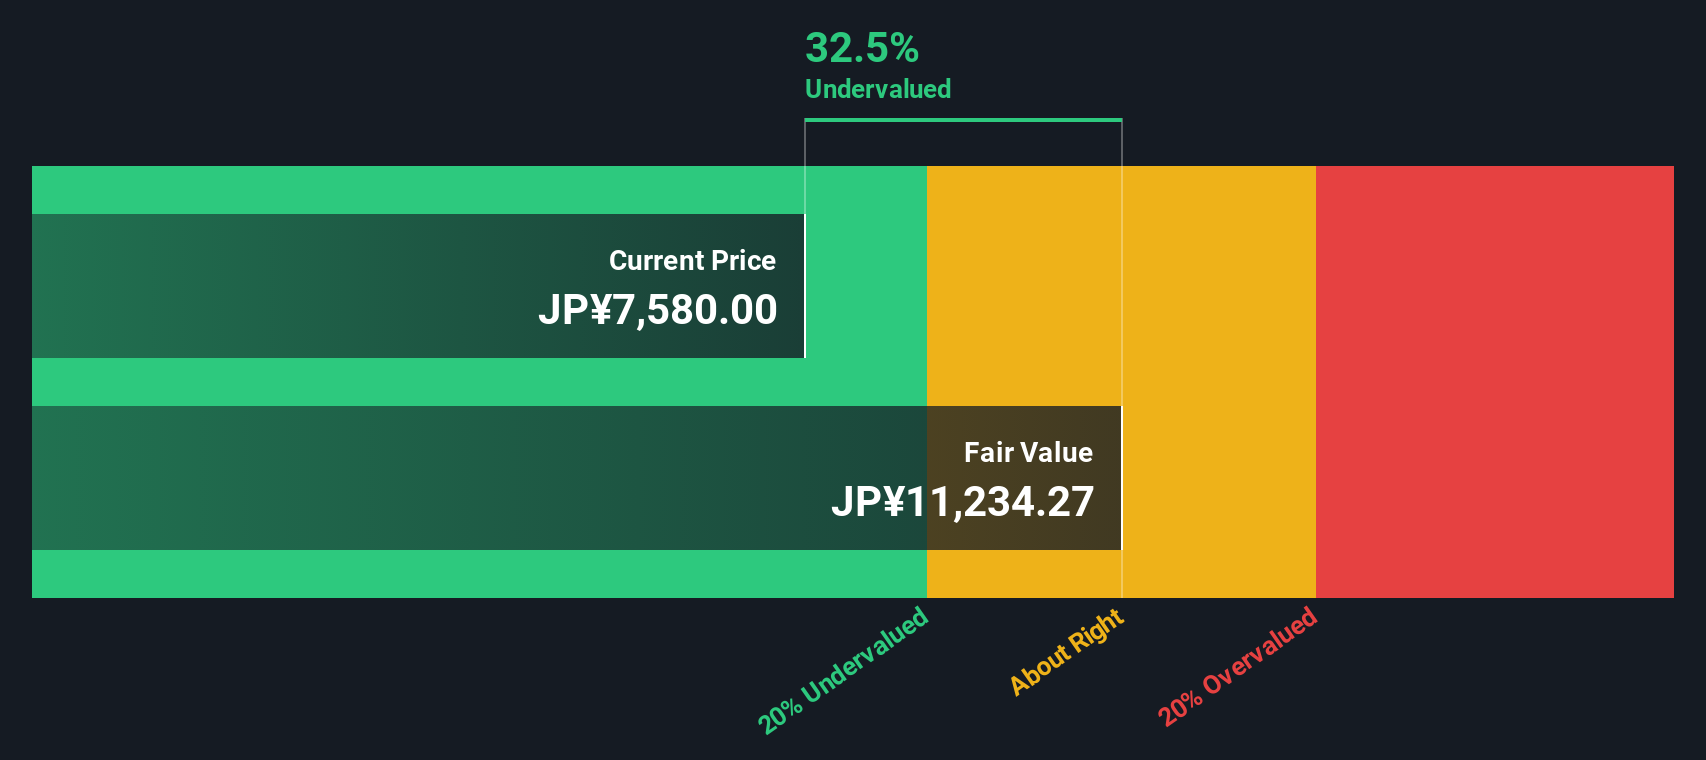
While the price-to-earnings ratio signals JINS HOLDINGS could be overvalued, our DCF model offers a different perspective. It estimates a fair value of ¥9,909.71, about 13.8% above the current share price. This suggests that, despite its high P/E, the stock may still offer value. Which view should investors trust?
Look into how the SWS DCF model arrives at its fair value.
Simply Wall St performs a discounted cash flow (DCF) on every stock in the world every day (check out JINS HOLDINGS for example). We show the entire calculation in full. You can track the result in your watchlist or portfolio and be alerted when this changes, or use our stock screener to discover undervalued stocks based on their cash flows. If you save a screener we even alert you when new companies match - so you never miss a potential opportunity.
Build Your Own JINS HOLDINGS Narrative
If you have a different perspective or would rather conduct your own analysis, you can easily craft your own JINS HOLDINGS story in just a few minutes, and Do it your way.
A great starting point for your JINS HOLDINGS research is our analysis highlighting 3 key rewards and 1 important warning sign that could impact your investment decision.
Looking for more investment ideas?
Smart investors never settle for just one opportunity. Broaden your watchlist and boost your returns by targeting sectors with serious momentum and future potential.
- Tap into long-term growth by following these 19 dividend stocks with yields > 3%, which delivers attractive yields above 3% and puts income front and center in your strategy.
- Join the AI revolution and harness rapid innovation by checking out these 25 AI penny stocks, where technology leaders are shaping tomorrow’s breakthroughs.
- Position yourself ahead of the crowd with these 3574 penny stocks with strong financials as they emerge from obscurity with strong financials and unique market advantages.
This article by Simply Wall St is general in nature. We provide commentary based on historical data and analyst forecasts only using an unbiased methodology and our articles are not intended to be financial advice. It does not constitute a recommendation to buy or sell any stock, and does not take account of your objectives, or your financial situation. We aim to bring you long-term focused analysis driven by fundamental data. Note that our analysis may not factor in the latest price-sensitive company announcements or qualitative material. Simply Wall St has no position in any stocks mentioned.
New: Manage All Your Stock Portfolios in One Place
We've created the ultimate portfolio companion for stock investors, and it's free.
• Connect an unlimited number of Portfolios and see your total in one currency
• Be alerted to new Warning Signs or Risks via email or mobile
• Track the Fair Value of your stocks
Have feedback on this article? Concerned about the content? Get in touch with us directly. Alternatively, email editorial-team@simplywallst.com
About TSE:3046
JINS HOLDINGS
Through its subsidiaries, engages in the planning, manufacturing, sales, and import/export of eyewear in Japan and internationally.
Outstanding track record with flawless balance sheet.
Market Insights

Advertisement
Community Narratives
Kodiak AI - a potential 100 bagger opportunity?
Fair Value US$14.00|44.7% undervalued
DA
Community Contributor
A Fair Price for a Great Business Facing Real Threats
Fair Value US$383.06|13.0% undervalued
IM
Community Contributor
AXON And Shopify Integration Will Unlock Global Mobile Advertising
Fair Value US$646.30|0% overvalued
AN
Based on Analyst Price Targets