
Advertisement
Key Insights
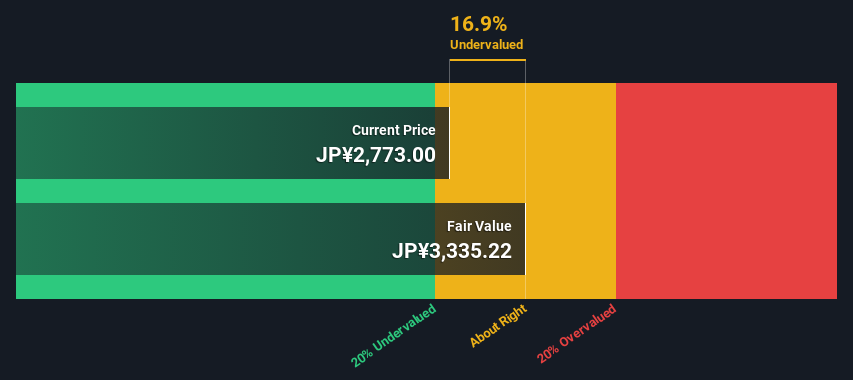
- Using the 2 Stage Free Cash Flow to Equity, ABC-MartInc fair value estimate is JP¥3,335
- With JP¥2,773 share price, ABC-MartInc appears to be trading close to its estimated fair value
- Our fair value estimate is 5.5% lower than ABC-MartInc's analyst price target of JP¥3,528
Today we'll do a simple run through of a valuation method used to estimate the attractiveness of ABC-Mart,Inc. (TSE:2670) as an investment opportunity by taking the forecast future cash flows of the company and discounting them back to today's value. We will use the Discounted Cash Flow (DCF) model on this occasion. Before you think you won't be able to understand it, just read on! It's actually much less complex than you'd imagine.
We generally believe that a company's value is the present value of all of the cash it will generate in the future. However, a DCF is just one valuation metric among many, and it is not without flaws. For those who are keen learners of equity analysis, the Simply Wall St analysis model here may be something of interest to you.
The Calculation
We're using the 2-stage growth model, which simply means we take in account two stages of company's growth. In the initial period the company may have a higher growth rate and the second stage is usually assumed to have a stable growth rate. To begin with, we have to get estimates of the next ten years of cash flows. Where possible we use analyst estimates, but when these aren't available we extrapolate the previous free cash flow (FCF) from the last estimate or reported value. We assume companies with shrinking free cash flow will slow their rate of shrinkage, and that companies with growing free cash flow will see their growth rate slow, over this period. We do this to reflect that growth tends to slow more in the early years than it does in later years.
A DCF is all about the idea that a dollar in the future is less valuable than a dollar today, so we discount the value of these future cash flows to their estimated value in today's dollars:
10-year free cash flow (FCF) forecast
| 2025 | 2026 | 2027 | 2028 | 2029 | 2030 | 2031 | 2032 | 2033 | 2034 | |
| Levered FCF (¥, Millions) | JP¥36.3b | JP¥41.0b | JP¥43.3b | JP¥44.3b | JP¥45.4b | JP¥46.2b | JP¥46.8b | JP¥47.2b | JP¥47.6b | JP¥48.0b |
| Growth Rate Estimate Source | Analyst x1 | Analyst x4 | Analyst x4 | Analyst x1 | Analyst x1 | Est @ 1.69% | Est @ 1.29% | Est @ 1.02% | Est @ 0.82% | Est @ 0.69% |
| Present Value (¥, Millions) Discounted @ 5.8% | JP¥34.3k | JP¥36.6k | JP¥36.5k | JP¥35.3k | JP¥34.2k | JP¥32.8k | JP¥31.4k | JP¥30.0k | JP¥28.6k | JP¥27.2k |
("Est" = FCF growth rate estimated by Simply Wall St)
Present Value of 10-year Cash Flow (PVCF) = JP¥327b
The second stage is also known as Terminal Value, this is the business's cash flow after the first stage. For a number of reasons a very conservative growth rate is used that cannot exceed that of a country's GDP growth. In this case we have used the 5-year average of the 10-year government bond yield (0.4%) to estimate future growth. In the same way as with the 10-year 'growth' period, we discount future cash flows to today's value, using a cost of equity of 5.8%.
Terminal Value (TV)= FCF2034 × (1 + g) ÷ (r – g) = JP¥48b× (1 + 0.4%) ÷ (5.8%– 0.4%) = JP¥880b
Present Value of Terminal Value (PVTV)= TV / (1 + r)10= JP¥880b÷ ( 1 + 5.8%)10= JP¥499b
The total value, or equity value, is then the sum of the present value of the future cash flows, which in this case is JP¥826b. To get the intrinsic value per share, we divide this by the total number of shares outstanding. Relative to the current share price of JP¥2.8k, the company appears about fair value at a 17% discount to where the stock price trades currently. Valuations are imprecise instruments though, rather like a telescope - move a few degrees and end up in a different galaxy. Do keep this in mind.
Important Assumptions
We would point out that the most important inputs to a discounted cash flow are the discount rate and of course the actual cash flows. You don't have to agree with these inputs, I recommend redoing the calculations yourself and playing with them. The DCF also does not consider the possible cyclicality of an industry, or a company's future capital requirements, so it does not give a full picture of a company's potential performance. Given that we are looking at ABC-MartInc as potential shareholders, the cost of equity is used as the discount rate, rather than the cost of capital (or weighted average cost of capital, WACC) which accounts for debt. In this calculation we've used 5.8%, which is based on a levered beta of 1.038. Beta is a measure of a stock's volatility, compared to the market as a whole. We get our beta from the industry average beta of globally comparable companies, with an imposed limit between 0.8 and 2.0, which is a reasonable range for a stable business.
Check out our latest analysis for ABC-MartInc
SWOT Analysis for ABC-MartInc
Strength
- Earnings growth over the past year exceeded the industry.
- Debt is not viewed as a risk.
- Dividends are covered by earnings and cash flows.
Weakness
- Earnings growth over the past year is below its 5-year average.
- Dividend is low compared to the top 25% of dividend payers in the Specialty Retail market.
Opportunity
- Annual earnings are forecast to grow for the next 4 years.
- Good value based on P/E ratio and estimated fair value.
Threat
- Annual earnings are forecast to grow slower than the Japanese market.
Moving On:
Valuation is only one side of the coin in terms of building your investment thesis, and it shouldn't be the only metric you look at when researching a company. DCF models are not the be-all and end-all of investment valuation. Rather it should be seen as a guide to "what assumptions need to be true for this stock to be under/overvalued?" For example, changes in the company's cost of equity or the risk free rate can significantly impact the valuation. For ABC-MartInc, we've compiled three pertinent aspects you should explore:
- Risks: Every company has them, and we've spotted 1 warning sign for ABC-MartInc you should know about.
- Future Earnings: How does 2670's growth rate compare to its peers and the wider market? Dig deeper into the analyst consensus number for the upcoming years by interacting with our free analyst growth expectation chart .
- Other Solid Businesses: Low debt, high returns on equity and good past performance are fundamental to a strong business. Why not explore our interactive list of stocks with solid business fundamentals to see if there are other companies you may not have considered!
PS. The Simply Wall St app conducts a discounted cash flow valuation for every stock on the TSE every day. If you want to find the calculation for other stocks just search here.
New: Manage All Your Stock Portfolios in One Place
We've created the ultimate portfolio companion for stock investors, and it's free.
• Connect an unlimited number of Portfolios and see your total in one currency
• Be alerted to new Warning Signs or Risks via email or mobile
• Track the Fair Value of your stocks
Have feedback on this article? Concerned about the content? Get in touch with us directly. Alternatively, email editorial-team (at) simplywallst.com.
This article by Simply Wall St is general in nature. We provide commentary based on historical data and analyst forecasts only using an unbiased methodology and our articles are not intended to be financial advice. It does not constitute a recommendation to buy or sell any stock, and does not take account of your objectives, or your financial situation. We aim to bring you long-term focused analysis driven by fundamental data. Note that our analysis may not factor in the latest price-sensitive company announcements or qualitative material. Simply Wall St has no position in any stocks mentioned.
About TSE:2670
ABC-MartInc
Engages in the retailing of shoes, clothing, and general merchandise products for men, women, and kids in Japan.
Excellent balance sheet with proven track record and pays a dividend.
Similar Companies
Market Insights

Advertisement
Community Narratives
The Next Phase of Energy Storage: How NeoVolta Is Tackling America’s Power Crunch
Fair Value US$7.50|35.1% undervalued
MA
Community Contributor
Why EnSilica is Worth Possibly 13x its Current Price
Fair Value UK£5.00|89.8% undervalued
DO
Community Contributor
M&A Activity, Industry Diversification & A Defense Contract Monopoly Will Push BWXT For Healthy Long-Term Growth
Fair Value US$220.00|15.2% undervalued
CL
Community Contributor
A case for Cassiar Gold Corp (TSXV: GLDC) to reach CAD$8-10 before 2030 (X30-37)
Fair Value CA$10.00|96.0% undervalued
AG
Community Contributor