

Legendary fund manager Li Lu (who Charlie Munger backed) once said, 'The biggest investment risk is not the volatility of prices, but whether you will suffer a permanent loss of capital.' So it might be obvious that you need to consider debt, when you think about how risky any given stock is, because too much debt can sink a company. We note that ANAP Inc. (TYO:3189) does have debt on its balance sheet. But the real question is whether this debt is making the company risky.
Why Does Debt Bring Risk?
Debt is a tool to help businesses grow, but if a business is incapable of paying off its lenders, then it exists at their mercy. If things get really bad, the lenders can take control of the business. However, a more frequent (but still costly) occurrence is where a company must issue shares at bargain-basement prices, permanently diluting shareholders, just to shore up its balance sheet. Of course, debt can be an important tool in businesses, particularly capital heavy businesses. The first step when considering a company's debt levels is to consider its cash and debt together.
View our latest analysis for ANAP
What Is ANAP's Net Debt?
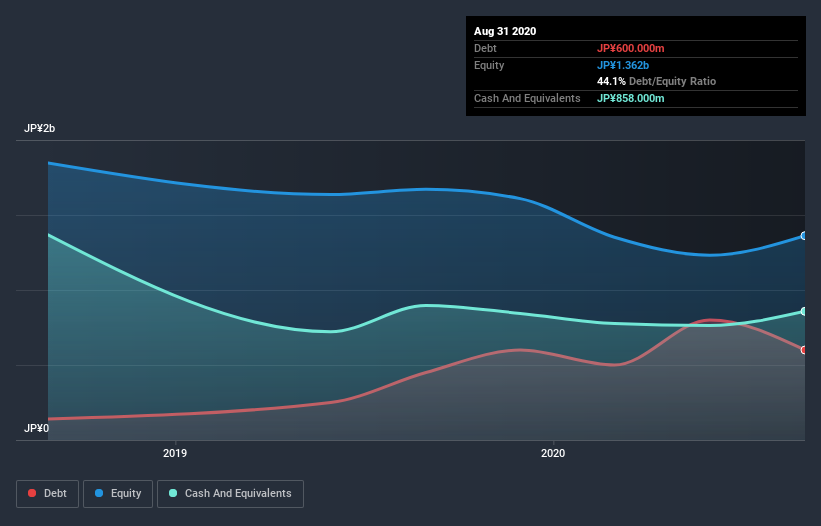
The image below, which you can click on for greater detail, shows that at August 2020 ANAP had debt of JP¥600.0m, up from JP¥450.0m in one year. But it also has JP¥858.0m in cash to offset that, meaning it has JP¥258.0m net cash.
A Look At ANAP's Liabilities
According to the last reported balance sheet, ANAP had liabilities of JP¥1.04b due within 12 months, and liabilities of JP¥327.0m due beyond 12 months. On the other hand, it had cash of JP¥858.0m and JP¥334.0m worth of receivables due within a year. So its liabilities total JP¥174.0m more than the combination of its cash and short-term receivables.
Of course, ANAP has a market capitalization of JP¥1.89b, so these liabilities are probably manageable. But there are sufficient liabilities that we would certainly recommend shareholders continue to monitor the balance sheet, going forward. Despite its noteworthy liabilities, ANAP boasts net cash, so it's fair to say it does not have a heavy debt load! When analysing debt levels, the balance sheet is the obvious place to start. But it is ANAP's earnings that will influence how the balance sheet holds up in the future. So when considering debt, it's definitely worth looking at the earnings trend. Click here for an interactive snapshot.
Over 12 months, ANAP made a loss at the EBIT level, and saw its revenue drop to JP¥5.7b, which is a fall of 9.6%. That's not what we would hope to see.
So How Risky Is ANAP?
Statistically speaking companies that lose money are riskier than those that make money. And the fact is that over the last twelve months ANAP lost money at the earnings before interest and tax (EBIT) line. Indeed, in that time it burnt through JP¥143m of cash and made a loss of JP¥371m. With only JP¥258.0m on the balance sheet, it would appear that its going to need to raise capital again soon. Overall, we'd say the stock is a bit risky, and we're usually very cautious until we see positive free cash flow. When analysing debt levels, the balance sheet is the obvious place to start. But ultimately, every company can contain risks that exist outside of the balance sheet. Case in point: We've spotted 4 warning signs for ANAP you should be aware of, and 1 of them is a bit concerning.
Of course, if you're the type of investor who prefers buying stocks without the burden of debt, then don't hesitate to discover our exclusive list of net cash growth stocks, today.
If you decide to trade ANAP, use the lowest-cost* platform that is rated #1 Overall by Barron’s, Interactive Brokers. Trade stocks, options, futures, forex, bonds and funds on 135 markets, all from a single integrated account. Promoted
If you're looking to trade Anap Holdings, open an account with the lowest-cost platform trusted by professionals, Interactive Brokers.
With clients in over 200 countries and territories, and access to 160 markets, IBKR lets you trade stocks, options, futures, forex, bonds and funds from a single integrated account.
Enjoy no hidden fees, no account minimums, and FX conversion rates as low as 0.03%, far better than what most brokers offer.
Sponsored ContentNew: Manage All Your Stock Portfolios in One Place
We've created the ultimate portfolio companion for stock investors, and it's free.
• Connect an unlimited number of Portfolios and see your total in one currency
• Be alerted to new Warning Signs or Risks via email or mobile
• Track the Fair Value of your stocks
This article by Simply Wall St is general in nature. It does not constitute a recommendation to buy or sell any stock, and does not take account of your objectives, or your financial situation. We aim to bring you long-term focused analysis driven by fundamental data. Note that our analysis may not factor in the latest price-sensitive company announcements or qualitative material. Simply Wall St has no position in any stocks mentioned.
*Interactive Brokers Rated Lowest Cost Broker by StockBrokers.com Annual Online Review 2020
Have feedback on this article? Concerned about the content? Get in touch with us directly. Alternatively, email editorial-team (at) simplywallst.com.
About TSE:3189
Medium-low with weak fundamentals.
Market Insights

Community Narratives

