
Advertisement
- Japan
- /
- Real Estate
- /
- TSE:3494
More Unpleasant Surprises Could Be In Store For Mullion Co., Ltd.'s (TSE:3494) Shares After Tumbling 28%
The Mullion Co., Ltd. (TSE:3494) share price has softened a substantial 28% over the previous 30 days, handing back much of the gains the stock has made lately. The good news is that in the last year, the stock has shone bright like a diamond, gaining 115%.
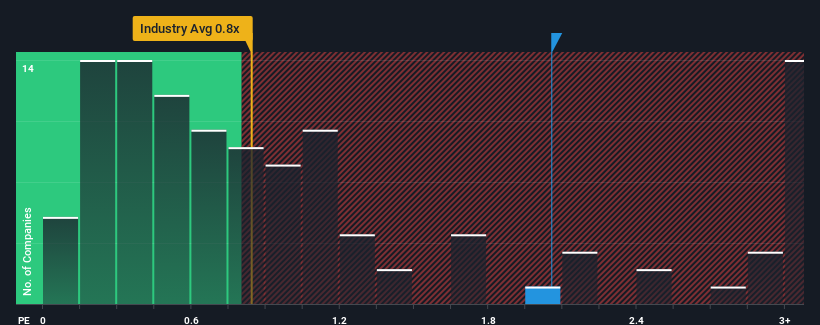
Although its price has dipped substantially, given close to half the companies operating in Japan's Real Estate industry have price-to-sales ratios (or "P/S") below 0.8x, you may still consider Mullion as a stock to potentially avoid with its 2.1x P/S ratio. Nonetheless, we'd need to dig a little deeper to determine if there is a rational basis for the elevated P/S.
Check out our latest analysis for Mullion
What Does Mullion's P/S Mean For Shareholders?
For example, consider that Mullion's financial performance has been poor lately as its revenue has been in decline. One possibility is that the P/S is high because investors think the company will still do enough to outperform the broader industry in the near future. However, if this isn't the case, investors might get caught out paying too much for the stock.
We don't have analyst forecasts, but you can see how recent trends are setting up the company for the future by checking out our free report on Mullion's earnings, revenue and cash flow.How Is Mullion's Revenue Growth Trending?
There's an inherent assumption that a company should outperform the industry for P/S ratios like Mullion's to be considered reasonable.
Retrospectively, the last year delivered a frustrating 53% decrease to the company's top line. This means it has also seen a slide in revenue over the longer-term as revenue is down 58% in total over the last three years. So unfortunately, we have to acknowledge that the company has not done a great job of growing revenue over that time.
In contrast to the company, the rest of the industry is expected to grow by 5.8% over the next year, which really puts the company's recent medium-term revenue decline into perspective.
With this in mind, we find it worrying that Mullion's P/S exceeds that of its industry peers. It seems most investors are ignoring the recent poor growth rate and are hoping for a turnaround in the company's business prospects. There's a very good chance existing shareholders are setting themselves up for future disappointment if the P/S falls to levels more in line with the recent negative growth rates.
What We Can Learn From Mullion's P/S?
Despite the recent share price weakness, Mullion's P/S remains higher than most other companies in the industry. Typically, we'd caution against reading too much into price-to-sales ratios when settling on investment decisions, though it can reveal plenty about what other market participants think about the company.
Our examination of Mullion revealed its shrinking revenue over the medium-term isn't resulting in a P/S as low as we expected, given the industry is set to grow. When we see revenue heading backwards and underperforming the industry forecasts, we feel the possibility of the share price declining is very real, bringing the P/S back into the realm of reasonability. Should recent medium-term revenue trends persist, it would pose a significant risk to existing shareholders' investments and prospective investors will have a hard time accepting the current value of the stock.
There are also other vital risk factors to consider and we've discovered 5 warning signs for Mullion (3 shouldn't be ignored!) that you should be aware of before investing here.
If companies with solid past earnings growth is up your alley, you may wish to see this free collection of other companies with strong earnings growth and low P/E ratios.
New: Manage All Your Stock Portfolios in One Place
We've created the ultimate portfolio companion for stock investors, and it's free.
• Connect an unlimited number of Portfolios and see your total in one currency
• Be alerted to new Warning Signs or Risks via email or mobile
• Track the Fair Value of your stocks
Have feedback on this article? Concerned about the content? Get in touch with us directly. Alternatively, email editorial-team (at) simplywallst.com.
This article by Simply Wall St is general in nature. We provide commentary based on historical data and analyst forecasts only using an unbiased methodology and our articles are not intended to be financial advice. It does not constitute a recommendation to buy or sell any stock, and does not take account of your objectives, or your financial situation. We aim to bring you long-term focused analysis driven by fundamental data. Note that our analysis may not factor in the latest price-sensitive company announcements or qualitative material. Simply Wall St has no position in any stocks mentioned.
About TSE:3494
Mullion
Engages in the real estate rental and securitization business in Japan.
Solid track record with low risk.
Market Insights

Advertisement
Community Narratives
The company that turned a verb into a global necessity and basically runs the modern internet, digital ads, smartphones, maps, and AI.
Fair Value US$300.00|6.3% undervalued
OS
Community Contributor
Flowers Foods Pays A Fair Price For Health
Fair Value US$16.12|26.0% undervalued
NV
Community Contributor
TMX Group will thrive with 33.3% profit margin and enduring market moat
Fair Value CA$49.90|3.7% overvalued
LI
Community Contributor