
Advertisement
- Japan
- /
- Real Estate
- /
- TSE:3289
Tokyu Fudosan Holdings Corporation's (TSE:3289) Intrinsic Value Is Potentially 58% Above Its Share Price

Key Insights
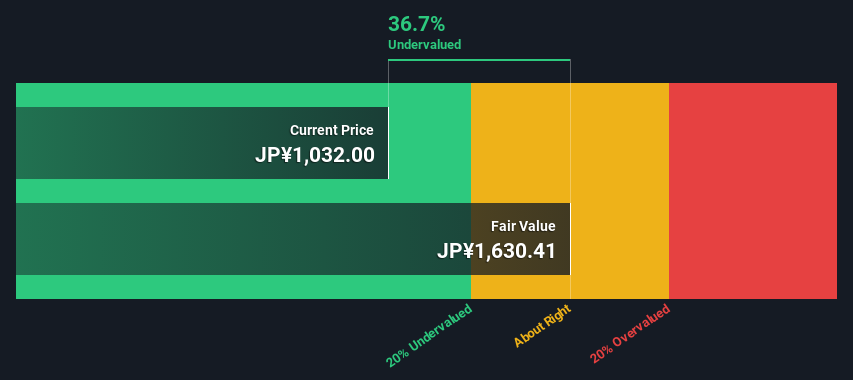
- Tokyu Fudosan Holdings' estimated fair value is JP¥1,630 based on 2 Stage Free Cash Flow to Equity
- Current share price of JP¥1,032 suggests Tokyu Fudosan Holdings is potentially 37% undervalued
- Our fair value estimate is 27% higher than Tokyu Fudosan Holdings' analyst price target of JP¥1,284
In this article we are going to estimate the intrinsic value of Tokyu Fudosan Holdings Corporation (TSE:3289) by estimating the company's future cash flows and discounting them to their present value. We will take advantage of the Discounted Cash Flow (DCF) model for this purpose. Before you think you won't be able to understand it, just read on! It's actually much less complex than you'd imagine.
Companies can be valued in a lot of ways, so we would point out that a DCF is not perfect for every situation. If you still have some burning questions about this type of valuation, take a look at the Simply Wall St analysis model.
View our latest analysis for Tokyu Fudosan Holdings
What's The Estimated Valuation?
We are going to use a two-stage DCF model, which, as the name states, takes into account two stages of growth. The first stage is generally a higher growth period which levels off heading towards the terminal value, captured in the second 'steady growth' period. To start off with, we need to estimate the next ten years of cash flows. Where possible we use analyst estimates, but when these aren't available we extrapolate the previous free cash flow (FCF) from the last estimate or reported value. We assume companies with shrinking free cash flow will slow their rate of shrinkage, and that companies with growing free cash flow will see their growth rate slow, over this period. We do this to reflect that growth tends to slow more in the early years than it does in later years.
Generally we assume that a dollar today is more valuable than a dollar in the future, and so the sum of these future cash flows is then discounted to today's value:
10-year free cash flow (FCF) forecast
| 2025 | 2026 | 2027 | 2028 | 2029 | 2030 | 2031 | 2032 | 2033 | 2034 | |
| Levered FCF (¥, Millions) | -JP¥70.1b | JP¥5.49b | JP¥25.5b | JP¥46.7b | JP¥74.0b | JP¥104.3b | JP¥134.3b | JP¥161.4b | JP¥184.3b | JP¥202.8b |
| Growth Rate Estimate Source | Analyst x1 | Analyst x1 | Analyst x1 | Est @ 83.29% | Est @ 58.38% | Est @ 40.94% | Est @ 28.74% | Est @ 20.20% | Est @ 14.21% | Est @ 10.03% |
| Present Value (¥, Millions) Discounted @ 10% | -JP¥63.6k | JP¥4.5k | JP¥19.0k | JP¥31.7k | JP¥45.5k | JP¥58.2k | JP¥67.9k | JP¥74.1k | JP¥76.8k | JP¥76.6k |
("Est" = FCF growth rate estimated by Simply Wall St)
Present Value of 10-year Cash Flow (PVCF) = JP¥391b
After calculating the present value of future cash flows in the initial 10-year period, we need to calculate the Terminal Value, which accounts for all future cash flows beyond the first stage. The Gordon Growth formula is used to calculate Terminal Value at a future annual growth rate equal to the 5-year average of the 10-year government bond yield of 0.3%. We discount the terminal cash flows to today's value at a cost of equity of 10%.
Terminal Value (TV)= FCF2034 × (1 + g) ÷ (r – g) = JP¥203b× (1 + 0.3%) ÷ (10%– 0.3%) = JP¥2.0t
Present Value of Terminal Value (PVTV)= TV / (1 + r)10= JP¥2.0t÷ ( 1 + 10%)10= JP¥771b
The total value is the sum of cash flows for the next ten years plus the discounted terminal value, which results in the Total Equity Value, which in this case is JP¥1.2t. To get the intrinsic value per share, we divide this by the total number of shares outstanding. Compared to the current share price of JP¥1.0k, the company appears quite undervalued at a 37% discount to where the stock price trades currently. Remember though, that this is just an approximate valuation, and like any complex formula - garbage in, garbage out.
Important Assumptions
We would point out that the most important inputs to a discounted cash flow are the discount rate and of course the actual cash flows. You don't have to agree with these inputs, I recommend redoing the calculations yourself and playing with them. The DCF also does not consider the possible cyclicality of an industry, or a company's future capital requirements, so it does not give a full picture of a company's potential performance. Given that we are looking at Tokyu Fudosan Holdings as potential shareholders, the cost of equity is used as the discount rate, rather than the cost of capital (or weighted average cost of capital, WACC) which accounts for debt. In this calculation we've used 10%, which is based on a levered beta of 2.000. Beta is a measure of a stock's volatility, compared to the market as a whole. We get our beta from the industry average beta of globally comparable companies, with an imposed limit between 0.8 and 2.0, which is a reasonable range for a stable business.
SWOT Analysis for Tokyu Fudosan Holdings
Strength
- Debt is well covered by earnings.
Weakness
- Earnings growth over the past year underperformed the Real Estate industry.
- Dividend is low compared to the top 25% of dividend payers in the Real Estate market.
Opportunity
- Annual earnings are forecast to grow for the next 3 years.
- Good value based on P/E ratio and estimated fair value.
Threat
- Debt is not well covered by operating cash flow.
- Paying a dividend but company has no free cash flows.
- Annual earnings are forecast to grow slower than the Japanese market.
Looking Ahead:
Whilst important, the DCF calculation is only one of many factors that you need to assess for a company. The DCF model is not a perfect stock valuation tool. Rather it should be seen as a guide to "what assumptions need to be true for this stock to be under/overvalued?" For instance, if the terminal value growth rate is adjusted slightly, it can dramatically alter the overall result. What is the reason for the share price sitting below the intrinsic value? For Tokyu Fudosan Holdings, we've compiled three fundamental factors you should further examine:
- Risks: Consider for instance, the ever-present spectre of investment risk. We've identified 2 warning signs with Tokyu Fudosan Holdings (at least 1 which is concerning) , and understanding them should be part of your investment process.
- Future Earnings: How does 3289's growth rate compare to its peers and the wider market? Dig deeper into the analyst consensus number for the upcoming years by interacting with our free analyst growth expectation chart.
- Other Solid Businesses: Low debt, high returns on equity and good past performance are fundamental to a strong business. Why not explore our interactive list of stocks with solid business fundamentals to see if there are other companies you may not have considered!
PS. The Simply Wall St app conducts a discounted cash flow valuation for every stock on the TSE every day. If you want to find the calculation for other stocks just search here.
Valuation is complex, but we're here to simplify it.
Discover if Tokyu Fudosan Holdings might be undervalued or overvalued with our detailed analysis, featuring fair value estimates, potential risks, dividends, insider trades, and its financial condition.
Access Free AnalysisHave feedback on this article? Concerned about the content? Get in touch with us directly. Alternatively, email editorial-team (at) simplywallst.com.
This article by Simply Wall St is general in nature. We provide commentary based on historical data and analyst forecasts only using an unbiased methodology and our articles are not intended to be financial advice. It does not constitute a recommendation to buy or sell any stock, and does not take account of your objectives, or your financial situation. We aim to bring you long-term focused analysis driven by fundamental data. Note that our analysis may not factor in the latest price-sensitive company announcements or qualitative material. Simply Wall St has no position in any stocks mentioned.
About TSE:3289
Tokyu Fudosan Holdings
Engages in the real estate business in Japan and internationally.
Undervalued average dividend payer.
Similar Companies
Market Insights

Advertisement
Community Narratives

BMW cruising ahead with new EVs and premium models to boost revenue 5%
Fair Value €135.07|45.0% undervalued
UN
Community Contributor
EU#2 - From Humble Beginnings to Global Powerhouse
Fair Value DKK 851.04|47.8% undervalued
TO
Community Contributor