Here's Why We're Not At All Concerned With MedRx's (TSE:4586) Cash Burn Situation


Even when a business is losing money, it's possible for shareholders to make money if they buy a good business at the right price. For example, although software-as-a-service business Salesforce.com lost money for years while it grew recurring revenue, if you held shares since 2005, you'd have done very well indeed. But while the successes are well known, investors should not ignore the very many unprofitable companies that simply burn through all their cash and collapse.
Given this risk, we thought we'd take a look at whether MedRx (TSE:4586) shareholders should be worried about its cash burn. In this report, we will consider the company's annual negative free cash flow, henceforth referring to it as the 'cash burn'. The first step is to compare its cash burn with its cash reserves, to give us its 'cash runway'.
Check out our latest analysis for MedRx
How Long Is MedRx's Cash Runway?
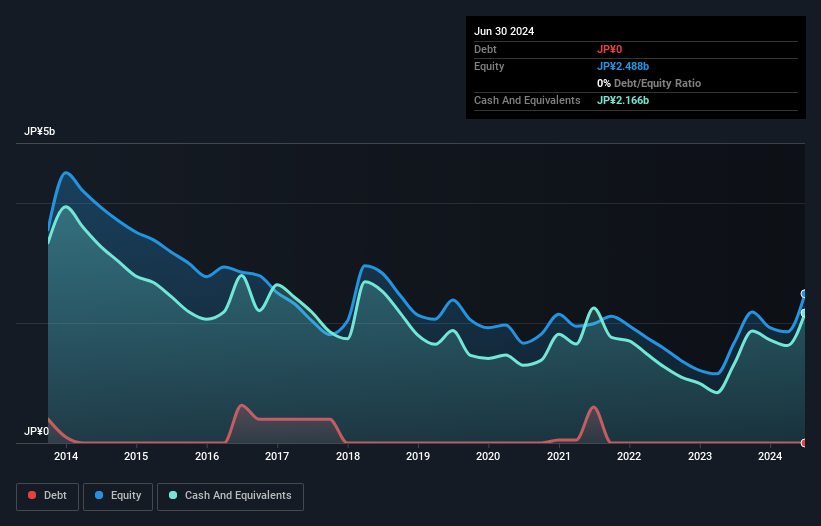
A company's cash runway is calculated by dividing its cash hoard by its cash burn. As at June 2024, MedRx had cash of JP¥2.2b and no debt. In the last year, its cash burn was JP¥516m. So it had a cash runway of about 4.2 years from June 2024. A runway of this length affords the company the time and space it needs to develop the business. Depicted below, you can see how its cash holdings have changed over time.
How Is MedRx's Cash Burn Changing Over Time?
In the last year, MedRx did book revenue of JP¥254m, but its revenue from operations was less, at just JP¥1.0m. Given how low that operating leverage is, we think it's too early to put much weight on the revenue growth, so we'll focus on how the cash burn is changing, instead. The 59% reduction in its cash burn over the last twelve months may be good for protecting the balance sheet but it hardly points to imminent growth. MedRx makes us a little nervous due to its lack of substantial operating revenue. We prefer most of the stocks on this list of stocks that analysts expect to grow.
Can MedRx Raise More Cash Easily?
There's no doubt MedRx's rapidly reducing cash burn brings comfort, but even if it's only hypothetical, it's always worth asking how easily it could raise more money to fund further growth. Generally speaking, a listed business can raise new cash through issuing shares or taking on debt. Many companies end up issuing new shares to fund future growth. By looking at a company's cash burn relative to its market capitalisation, we gain insight on how much shareholders would be diluted if the company needed to raise enough cash to cover another year's cash burn.
MedRx has a market capitalisation of JP¥4.6b and burnt through JP¥516m last year, which is 11% of the company's market value. Given that situation, it's fair to say the company wouldn't have much trouble raising more cash for growth, but shareholders would be somewhat diluted.
So, Should We Worry About MedRx's Cash Burn?
As you can probably tell by now, we're not too worried about MedRx's cash burn. For example, we think its cash runway suggests that the company is on a good path. And even though its cash burn relative to its market cap wasn't quite as impressive, it was still a positive. After taking into account the various metrics mentioned in this report, we're pretty comfortable with how the company is spending its cash, as it seems on track to meet its needs over the medium term. Taking a deeper dive, we've spotted 4 warning signs for MedRx you should be aware of, and 1 of them is significant.
If you would prefer to check out another company with better fundamentals, then do not miss this free list of interesting companies, that have HIGH return on equity and low debt or this list of stocks which are all forecast to grow.
New: Manage All Your Stock Portfolios in One Place
We've created the ultimate portfolio companion for stock investors, and it's free.
• Connect an unlimited number of Portfolios and see your total in one currency
• Be alerted to new Warning Signs or Risks via email or mobile
• Track the Fair Value of your stocks
Have feedback on this article? Concerned about the content? Get in touch with us directly. Alternatively, email editorial-team (at) simplywallst.com.
This article by Simply Wall St is general in nature. We provide commentary based on historical data and analyst forecasts only using an unbiased methodology and our articles are not intended to be financial advice. It does not constitute a recommendation to buy or sell any stock, and does not take account of your objectives, or your financial situation. We aim to bring you long-term focused analysis driven by fundamental data. Note that our analysis may not factor in the latest price-sensitive company announcements or qualitative material. Simply Wall St has no position in any stocks mentioned.
About TSE:4586
MedRx
A pharmaceutical formulation development company, provides pharmaceutical drugs based on the transdermal absorption system in Japan.
Flawless balance sheet slight.

