Is Sumitomo Pharma Co., Ltd. (TSE:4506) Trading At A 34% Discount?


Key Insights
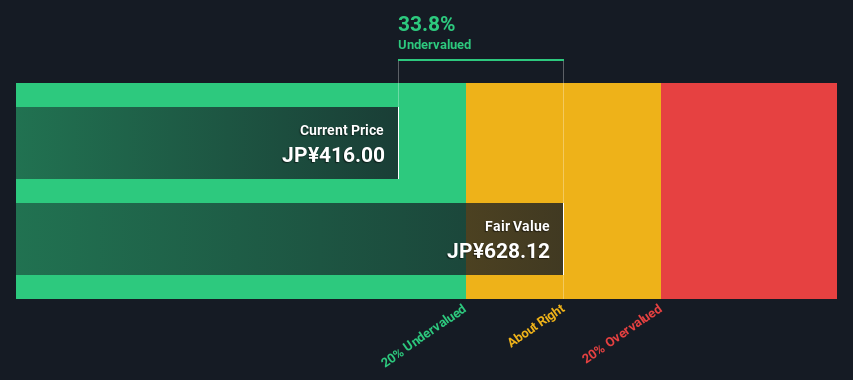
- Sumitomo Pharma's estimated fair value is JP¥628 based on 2 Stage Free Cash Flow to Equity
- Sumitomo Pharma is estimated to be 34% undervalued based on current share price of JP¥416
- Analyst price target for 4506 is JP¥334 which is 47% below our fair value estimate
Today we will run through one way of estimating the intrinsic value of Sumitomo Pharma Co., Ltd. (TSE:4506) by taking the expected future cash flows and discounting them to their present value. This will be done using the Discounted Cash Flow (DCF) model. Believe it or not, it's not too difficult to follow, as you'll see from our example!
We generally believe that a company's value is the present value of all of the cash it will generate in the future. However, a DCF is just one valuation metric among many, and it is not without flaws. Anyone interested in learning a bit more about intrinsic value should have a read of the Simply Wall St analysis model.
View our latest analysis for Sumitomo Pharma
The Model
We are going to use a two-stage DCF model, which, as the name states, takes into account two stages of growth. The first stage is generally a higher growth period which levels off heading towards the terminal value, captured in the second 'steady growth' period. To start off with, we need to estimate the next ten years of cash flows. Where possible we use analyst estimates, but when these aren't available we extrapolate the previous free cash flow (FCF) from the last estimate or reported value. We assume companies with shrinking free cash flow will slow their rate of shrinkage, and that companies with growing free cash flow will see their growth rate slow, over this period. We do this to reflect that growth tends to slow more in the early years than it does in later years.
A DCF is all about the idea that a dollar in the future is less valuable than a dollar today, and so the sum of these future cash flows is then discounted to today's value:
10-year free cash flow (FCF) forecast
| 2024 | 2025 | 2026 | 2027 | 2028 | 2029 | 2030 | 2031 | 2032 | 2033 | |
| Levered FCF (¥, Millions) | -JP¥127.1b | -JP¥26.5b | -JP¥2.03b | JP¥12.3b | JP¥9.97b | JP¥17.0b | JP¥22.7b | JP¥28.0b | JP¥32.6b | JP¥36.4b |
| Growth Rate Estimate Source | Analyst x4 | Analyst x3 | Analyst x4 | Analyst x3 | Analyst x3 | Analyst x1 | Est @ 33.55% | Est @ 23.54% | Est @ 16.54% | Est @ 11.64% |
| Present Value (¥, Millions) Discounted @ 6.7% | -JP¥119.2k | -JP¥23.3k | -JP¥1.7k | JP¥9.5k | JP¥7.2k | JP¥11.5k | JP¥14.4k | JP¥16.7k | JP¥18.3k | JP¥19.1k |
("Est" = FCF growth rate estimated by Simply Wall St)
Present Value of 10-year Cash Flow (PVCF) = -JP¥47b
After calculating the present value of future cash flows in the initial 10-year period, we need to calculate the Terminal Value, which accounts for all future cash flows beyond the first stage. For a number of reasons a very conservative growth rate is used that cannot exceed that of a country's GDP growth. In this case we have used the 5-year average of the 10-year government bond yield (0.2%) to estimate future growth. In the same way as with the 10-year 'growth' period, we discount future cash flows to today's value, using a cost of equity of 6.7%.
Terminal Value (TV)= FCF2033 × (1 + g) ÷ (r – g) = JP¥36b× (1 + 0.2%) ÷ (6.7%– 0.2%) = JP¥565b
Present Value of Terminal Value (PVTV)= TV / (1 + r)10= JP¥565b÷ ( 1 + 6.7%)10= JP¥297b
The total value is the sum of cash flows for the next ten years plus the discounted terminal value, which results in the Total Equity Value, which in this case is JP¥250b. In the final step we divide the equity value by the number of shares outstanding. Compared to the current share price of JP¥416, the company appears quite good value at a 34% discount to where the stock price trades currently. Remember though, that this is just an approximate valuation, and like any complex formula - garbage in, garbage out.
The Assumptions
The calculation above is very dependent on two assumptions. The first is the discount rate and the other is the cash flows. You don't have to agree with these inputs, I recommend redoing the calculations yourself and playing with them. The DCF also does not consider the possible cyclicality of an industry, or a company's future capital requirements, so it does not give a full picture of a company's potential performance. Given that we are looking at Sumitomo Pharma as potential shareholders, the cost of equity is used as the discount rate, rather than the cost of capital (or weighted average cost of capital, WACC) which accounts for debt. In this calculation we've used 6.7%, which is based on a levered beta of 1.147. Beta is a measure of a stock's volatility, compared to the market as a whole. We get our beta from the industry average beta of globally comparable companies, with an imposed limit between 0.8 and 2.0, which is a reasonable range for a stable business.
SWOT Analysis for Sumitomo Pharma
- Debt is well covered by earnings.
- No major weaknesses identified for 4506.
- Forecast to reduce losses next year.
- Has sufficient cash runway for more than 3 years based on current free cash flows.
- Good value based on P/S ratio and estimated fair value.
- Debt is not well covered by operating cash flow.
- Not expected to become profitable over the next 3 years.
Looking Ahead:
Whilst important, the DCF calculation ideally won't be the sole piece of analysis you scrutinize for a company. It's not possible to obtain a foolproof valuation with a DCF model. Preferably you'd apply different cases and assumptions and see how they would impact the company's valuation. If a company grows at a different rate, or if its cost of equity or risk free rate changes sharply, the output can look very different. Why is the intrinsic value higher than the current share price? For Sumitomo Pharma, we've compiled three pertinent aspects you should look at:
- Risks: Be aware that Sumitomo Pharma is showing 2 warning signs in our investment analysis , and 1 of those doesn't sit too well with us...
- Future Earnings: How does 4506's growth rate compare to its peers and the wider market? Dig deeper into the analyst consensus number for the upcoming years by interacting with our free analyst growth expectation chart.
- Other Solid Businesses: Low debt, high returns on equity and good past performance are fundamental to a strong business. Why not explore our interactive list of stocks with solid business fundamentals to see if there are other companies you may not have considered!
PS. The Simply Wall St app conducts a discounted cash flow valuation for every stock on the TSE every day. If you want to find the calculation for other stocks just search here.
New: Manage All Your Stock Portfolios in One Place
We've created the ultimate portfolio companion for stock investors, and it's free.
• Connect an unlimited number of Portfolios and see your total in one currency
• Be alerted to new Warning Signs or Risks via email or mobile
• Track the Fair Value of your stocks
Have feedback on this article? Concerned about the content? Get in touch with us directly. Alternatively, email editorial-team (at) simplywallst.com.
This article by Simply Wall St is general in nature. We provide commentary based on historical data and analyst forecasts only using an unbiased methodology and our articles are not intended to be financial advice. It does not constitute a recommendation to buy or sell any stock, and does not take account of your objectives, or your financial situation. We aim to bring you long-term focused analysis driven by fundamental data. Note that our analysis may not factor in the latest price-sensitive company announcements or qualitative material. Simply Wall St has no position in any stocks mentioned.
About TSE:4506
Sumitomo Pharma
Engages in the manufacture and sale of pharmaceuticals, food ingredients and additives, veterinary medicines, and others in Japan, North America, China, and internationally.
Undervalued with moderate growth potential.
Similar Companies
Market Insights

Community Narratives


