
Advertisement
Warren Buffett famously said, 'Volatility is far from synonymous with risk.' When we think about how risky a company is, we always like to look at its use of debt, since debt overload can lead to ruin. Importantly, GNI Group Ltd. (TSE:2160) does carry debt. But should shareholders be worried about its use of debt?
What Risk Does Debt Bring?
Debt and other liabilities become risky for a business when it cannot easily fulfill those obligations, either with free cash flow or by raising capital at an attractive price. Part and parcel of capitalism is the process of 'creative destruction' where failed businesses are mercilessly liquidated by their bankers. While that is not too common, we often do see indebted companies permanently diluting shareholders because lenders force them to raise capital at a distressed price. Of course, plenty of companies use debt to fund growth, without any negative consequences. The first step when considering a company's debt levels is to consider its cash and debt together.
View our latest analysis for GNI Group
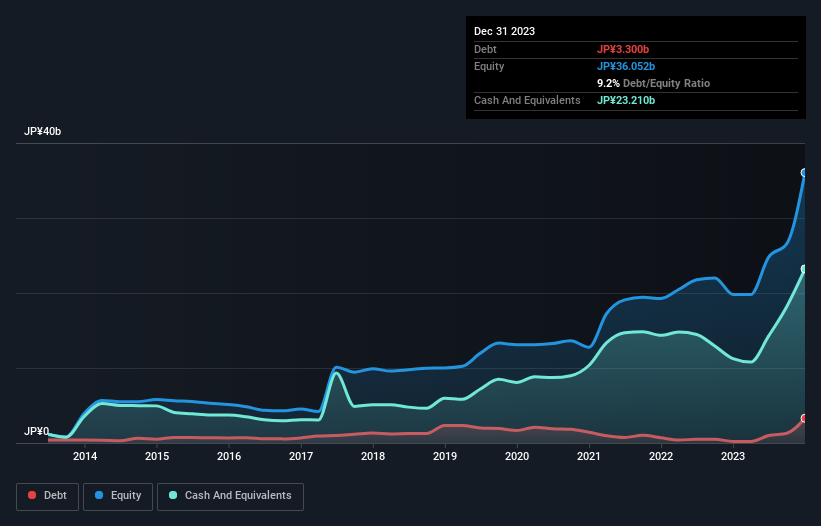
How Much Debt Does GNI Group Carry?
You can click the graphic below for the historical numbers, but it shows that as of December 2023 GNI Group had JP¥3.30b of debt, an increase on JP¥200.0m, over one year. However, it does have JP¥23.2b in cash offsetting this, leading to net cash of JP¥19.9b.
A Look At GNI Group's Liabilities
The latest balance sheet data shows that GNI Group had liabilities of JP¥8.19b due within a year, and liabilities of JP¥18.1b falling due after that. Offsetting this, it had JP¥23.2b in cash and JP¥3.97b in receivables that were due within 12 months. So it actually has JP¥841.0m more liquid assets than total liabilities.
Having regard to GNI Group's size, it seems that its liquid assets are well balanced with its total liabilities. So while it's hard to imagine that the JP¥135.6b company is struggling for cash, we still think it's worth monitoring its balance sheet. Succinctly put, GNI Group boasts net cash, so it's fair to say it does not have a heavy debt load!
Pleasingly, GNI Group is growing its EBIT faster than former Australian PM Bob Hawke downs a yard glass, boasting a 285% gain in the last twelve months. There's no doubt that we learn most about debt from the balance sheet. But ultimately the future profitability of the business will decide if GNI Group can strengthen its balance sheet over time. So if you want to see what the professionals think, you might find this free report on analyst profit forecasts to be interesting.
Finally, while the tax-man may adore accounting profits, lenders only accept cold hard cash. GNI Group may have net cash on the balance sheet, but it is still interesting to look at how well the business converts its earnings before interest and tax (EBIT) to free cash flow, because that will influence both its need for, and its capacity to manage debt. Looking at the most recent three years, GNI Group recorded free cash flow of 42% of its EBIT, which is weaker than we'd expect. That's not great, when it comes to paying down debt.
Summing Up
While it is always sensible to investigate a company's debt, in this case GNI Group has JP¥19.9b in net cash and a decent-looking balance sheet. And it impressed us with its EBIT growth of 285% over the last year. So we don't think GNI Group's use of debt is risky. There's no doubt that we learn most about debt from the balance sheet. However, not all investment risk resides within the balance sheet - far from it. For instance, we've identified 3 warning signs for GNI Group (2 are concerning) you should be aware of.
When all is said and done, sometimes its easier to focus on companies that don't even need debt. Readers can access a list of growth stocks with zero net debt 100% free, right now.
New: Manage All Your Stock Portfolios in One Place
We've created the ultimate portfolio companion for stock investors, and it's free.
• Connect an unlimited number of Portfolios and see your total in one currency
• Be alerted to new Warning Signs or Risks via email or mobile
• Track the Fair Value of your stocks
Have feedback on this article? Concerned about the content? Get in touch with us directly. Alternatively, email editorial-team (at) simplywallst.com.
This article by Simply Wall St is general in nature. We provide commentary based on historical data and analyst forecasts only using an unbiased methodology and our articles are not intended to be financial advice. It does not constitute a recommendation to buy or sell any stock, and does not take account of your objectives, or your financial situation. We aim to bring you long-term focused analysis driven by fundamental data. Note that our analysis may not factor in the latest price-sensitive company announcements or qualitative material. Simply Wall St has no position in any stocks mentioned.
About TSE:2160
GNI Group
Engages in the research, development, manufacture, and sale of pharmaceutical drugs in Japan and internationally.
Undervalued with high growth potential.
Market Insights

Advertisement
Community Narratives
Kodiak AI - a potential 100 bagger opportunity?
Fair Value US$14.00|44.7% undervalued
DA
Community Contributor
A Fair Price for a Great Business Facing Real Threats
Fair Value US$383.06|13.0% undervalued
IM
Community Contributor
AXON And Shopify Integration Will Unlock Global Mobile Advertising
Fair Value US$646.30|0% overvalued
AN
Based on Analyst Price Targets