
Advertisement

Legendary fund manager Li Lu (who Charlie Munger backed) once said, 'The biggest investment risk is not the volatility of prices, but whether you will suffer a permanent loss of capital.' So it seems the smart money knows that debt - which is usually involved in bankruptcies - is a very important factor, when you assess how risky a company is. Importantly, toridori Inc. (TSE:9337) does carry debt. But the more important question is: how much risk is that debt creating?
What Risk Does Debt Bring?
Debt is a tool to help businesses grow, but if a business is incapable of paying off its lenders, then it exists at their mercy. If things get really bad, the lenders can take control of the business. However, a more usual (but still expensive) situation is where a company must dilute shareholders at a cheap share price simply to get debt under control. Having said that, the most common situation is where a company manages its debt reasonably well - and to its own advantage. When we think about a company's use of debt, we first look at cash and debt together.
View our latest analysis for toridori
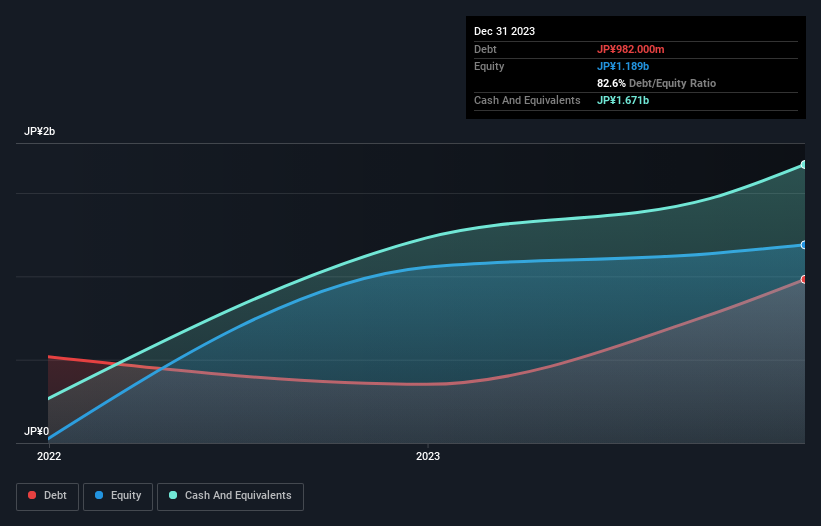
How Much Debt Does toridori Carry?
You can click the graphic below for the historical numbers, but it shows that as of December 2023 toridori had JP¥982.0m of debt, an increase on JP¥352.0m, over one year. But it also has JP¥1.67b in cash to offset that, meaning it has JP¥689.0m net cash.
A Look At toridori's Liabilities
Zooming in on the latest balance sheet data, we can see that toridori had liabilities of JP¥1.72b due within 12 months and liabilities of JP¥380.0m due beyond that. On the other hand, it had cash of JP¥1.67b and JP¥690.0m worth of receivables due within a year. So it can boast JP¥261.0m more liquid assets than total liabilities.
This short term liquidity is a sign that toridori could probably pay off its debt with ease, as its balance sheet is far from stretched. Simply put, the fact that toridori has more cash than debt is arguably a good indication that it can manage its debt safely.
Although toridori made a loss at the EBIT level, last year, it was also good to see that it generated JP¥124m in EBIT over the last twelve months. When analysing debt levels, the balance sheet is the obvious place to start. But it is toridori's earnings that will influence how the balance sheet holds up in the future. So if you're keen to discover more about its earnings, it might be worth checking out this graph of its long term earnings trend.
Finally, a business needs free cash flow to pay off debt; accounting profits just don't cut it. toridori may have net cash on the balance sheet, but it is still interesting to look at how well the business converts its earnings before interest and tax (EBIT) to free cash flow, because that will influence both its need for, and its capacity to manage debt. Over the last year, toridori saw substantial negative free cash flow, in total. While that may be a result of expenditure for growth, it does make the debt far more risky.
Summing Up
While it is always sensible to investigate a company's debt, in this case toridori has JP¥689.0m in net cash and a decent-looking balance sheet. So we are not troubled with toridori's debt use. The balance sheet is clearly the area to focus on when you are analysing debt. But ultimately, every company can contain risks that exist outside of the balance sheet. Be aware that toridori is showing 3 warning signs in our investment analysis , and 2 of those shouldn't be ignored...
Of course, if you're the type of investor who prefers buying stocks without the burden of debt, then don't hesitate to discover our exclusive list of net cash growth stocks, today.
New: Manage All Your Stock Portfolios in One Place
We've created the ultimate portfolio companion for stock investors, and it's free.
• Connect an unlimited number of Portfolios and see your total in one currency
• Be alerted to new Warning Signs or Risks via email or mobile
• Track the Fair Value of your stocks
Have feedback on this article? Concerned about the content? Get in touch with us directly. Alternatively, email editorial-team (at) simplywallst.com.
This article by Simply Wall St is general in nature. We provide commentary based on historical data and analyst forecasts only using an unbiased methodology and our articles are not intended to be financial advice. It does not constitute a recommendation to buy or sell any stock, and does not take account of your objectives, or your financial situation. We aim to bring you long-term focused analysis driven by fundamental data. Note that our analysis may not factor in the latest price-sensitive company announcements or qualitative material. Simply Wall St has no position in any stocks mentioned.
About TSE:9337
Proven track record with mediocre balance sheet.
Market Insights

Advertisement
Community Narratives
WhiteCap Is Positioned To Profit Regardless Of Trump's Policy 
Fair Value CA$22.60|61.7% undervalued
ST
Equity Analyst and Writer
Microsoft's Evolution Will Drive Revenue to New Heights Fueled by AI
Fair Value US$360.00|28.9% overvalued
BR
Community Contributor
A CASE FOR USD$2.50 (CAD$3.44) BY 2028 (A 5-10 BAGGER)
Fair Value CA$3.44|88.1% undervalued
AG
Community Contributor