
Advertisement
Optimistic Investors Push GEOCODE CO.,Ltd. (TSE:7357) Shares Up 42% But Growth Is Lacking
The GEOCODE CO.,Ltd. (TSE:7357) share price has done very well over the last month, posting an excellent gain of 42%. Looking back a bit further, it's encouraging to see the stock is up 28% in the last year.
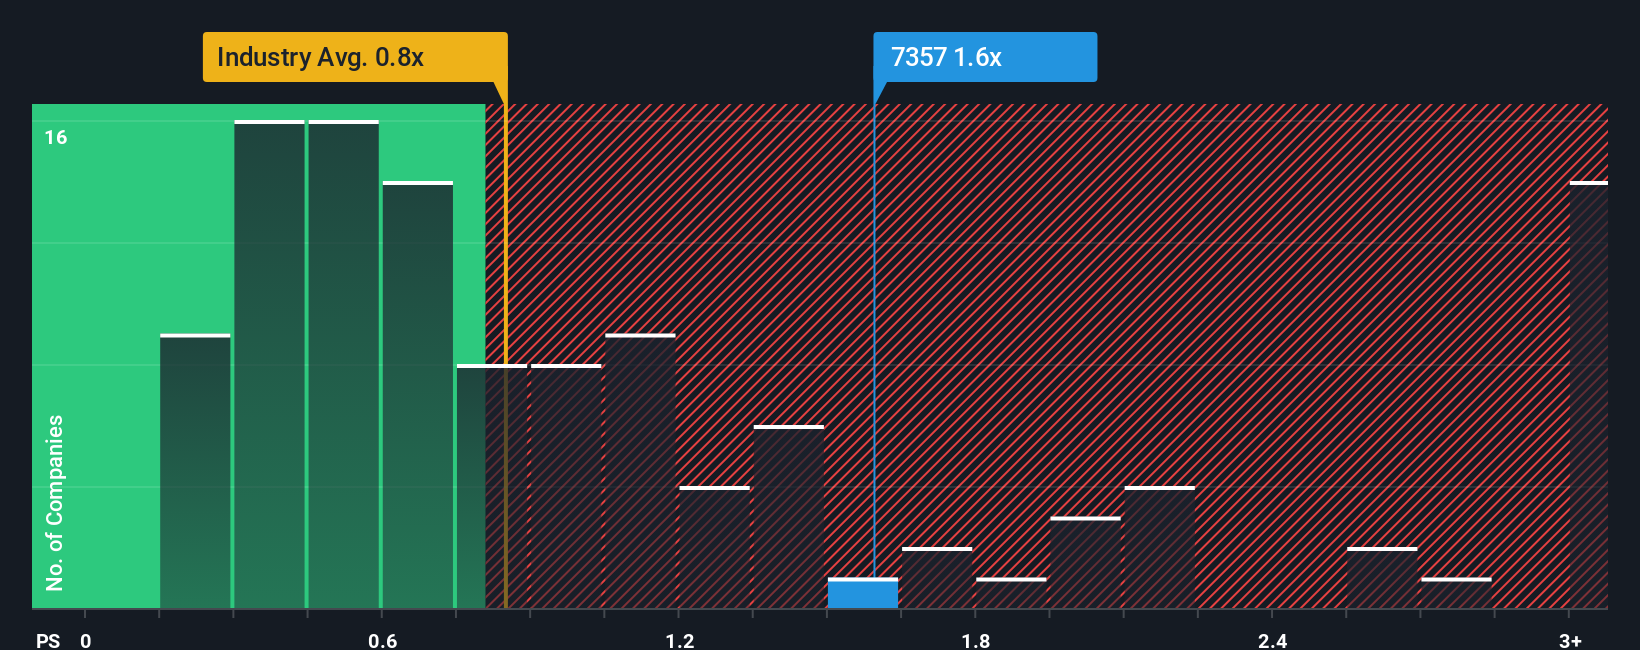
Following the firm bounce in price, given close to half the companies operating in Japan's Media industry have price-to-sales ratios (or "P/S") below 0.8x, you may consider GEOCODELtd as a stock to potentially avoid with its 1.6x P/S ratio. However, the P/S might be high for a reason and it requires further investigation to determine if it's justified.
See our latest analysis for GEOCODELtd
What Does GEOCODELtd's P/S Mean For Shareholders?
GEOCODELtd has been doing a decent job lately as it's been growing revenue at a reasonable pace. One possibility is that the P/S ratio is high because investors think this good revenue growth will be enough to outperform the broader industry in the near future. However, if this isn't the case, investors might get caught out paying too much for the stock.
Want the full picture on earnings, revenue and cash flow for the company? Then our free report on GEOCODELtd will help you shine a light on its historical performance.Is There Enough Revenue Growth Forecasted For GEOCODELtd?
GEOCODELtd's P/S ratio would be typical for a company that's expected to deliver solid growth, and importantly, perform better than the industry.
If we review the last year of revenue growth, the company posted a worthy increase of 4.1%. Still, lamentably revenue has fallen 54% in aggregate from three years ago, which is disappointing. Accordingly, shareholders would have felt downbeat about the medium-term rates of revenue growth.
Weighing that medium-term revenue trajectory against the broader industry's one-year forecast for expansion of 18% shows it's an unpleasant look.
In light of this, it's alarming that GEOCODELtd's P/S sits above the majority of other companies. It seems most investors are ignoring the recent poor growth rate and are hoping for a turnaround in the company's business prospects. There's a very good chance existing shareholders are setting themselves up for future disappointment if the P/S falls to levels more in line with the recent negative growth rates.
What Does GEOCODELtd's P/S Mean For Investors?
GEOCODELtd shares have taken a big step in a northerly direction, but its P/S is elevated as a result. Using the price-to-sales ratio alone to determine if you should sell your stock isn't sensible, however it can be a practical guide to the company's future prospects.
We've established that GEOCODELtd currently trades on a much higher than expected P/S since its recent revenues have been in decline over the medium-term. When we see revenue heading backwards and underperforming the industry forecasts, we feel the possibility of the share price declining is very real, bringing the P/S back into the realm of reasonability. Unless the the circumstances surrounding the recent medium-term improve, it wouldn't be wrong to expect a a difficult period ahead for the company's shareholders.
It's always necessary to consider the ever-present spectre of investment risk. We've identified 3 warning signs with GEOCODELtd (at least 1 which is potentially serious), and understanding them should be part of your investment process.
Of course, profitable companies with a history of great earnings growth are generally safer bets. So you may wish to see this free collection of other companies that have reasonable P/E ratios and have grown earnings strongly.
New: Manage All Your Stock Portfolios in One Place
We've created the ultimate portfolio companion for stock investors, and it's free.
• Connect an unlimited number of Portfolios and see your total in one currency
• Be alerted to new Warning Signs or Risks via email or mobile
• Track the Fair Value of your stocks
Have feedback on this article? Concerned about the content? Get in touch with us directly. Alternatively, email editorial-team (at) simplywallst.com.
This article by Simply Wall St is general in nature. We provide commentary based on historical data and analyst forecasts only using an unbiased methodology and our articles are not intended to be financial advice. It does not constitute a recommendation to buy or sell any stock, and does not take account of your objectives, or your financial situation. We aim to bring you long-term focused analysis driven by fundamental data. Note that our analysis may not factor in the latest price-sensitive company announcements or qualitative material. Simply Wall St has no position in any stocks mentioned.
About TSE:7357
GEOCODELtd
Engages in web marketing and cloud sales technology businesses in Japan and internationally.
Adequate balance sheet with low risk.
Market Insights

Advertisement
Community Narratives
MicroVision will explode future revenue by 380.37% with a vision towards success
Fair Value US$60|98.4% undervalued
TH
Community Contributor
The Indispensable Artery for a New North American Economy
Fair Value CA$132.87|0.7% overvalued
TI
Community Contributor
Recently Updated Narratives
CO

composite32 on Astor Enerji ·
Astor Enerji will surge with a fair value of $140.43 in the next 3 years
Fair Value:₺140.4335.5% undervalued
1 followerusers have followed this narrative
0 commentsusers have commented on this narrative
0 likesusers have liked this narrative
RE

RecMag on Proximus ·
Proximus: The State-Backed Backup Plan with 7% Gross Yield and 15% Currency Upside.
Fair Value:€17.1356.7% undervalued
30 followersusers have followed this narrative
0 commentsusers have commented on this narrative
0 likesusers have liked this narrative
AG


Agricola on IMPACT Silver ·
A case for for IMPACT Silver Corp (TSXV:IPT) to reach USD $4.52 (CAD $6.16) in 2026 (23 bagger in 1 year) and USD $5.76 (CAD $7.89) by 2030
Fair Value:CA$7.8996.2% undervalued
1 followerusers have followed this narrative
0 commentsusers have commented on this narrative
0 likesusers have liked this narrative
Popular Narratives
TH

TheWallstreetKing on MicroVision ·
MicroVision will explode future revenue by 380.37% with a vision towards success
Fair Value:US$6098.4% undervalued
101 followersusers have followed this narrative
10 commentsusers have commented on this narrative
20 likesusers have liked this narrative
OS


oscargarcia on Alphabet ·
The company that turned a verb into a global necessity and basically runs the modern internet, digital ads, smartphones, maps, and AI.
Fair Value:US$3405.8% undervalued
137 followersusers have followed this narrative
6 commentsusers have commented on this narrative
18 likesusers have liked this narrative
AN


AnalystConsensusTarget on NVIDIA ·
NVDA: Expanding AI Demand Will Drive Major Data Center Investments Through 2026
Fair Value:US$250.3929.3% undervalued
929 followersusers have followed this narrative
6 commentsusers have commented on this narrative
23 likesusers have liked this narrative