- Japan
- /
- Entertainment
- /
- TSE:3667
enish,inc. (TSE:3667) Stock Rockets 64% As Investors Are Less Pessimistic Than Expected


The enish,inc. (TSE:3667) share price has done very well over the last month, posting an excellent gain of 64%. Not all shareholders will be feeling jubilant, since the share price is still down a very disappointing 18% in the last twelve months.
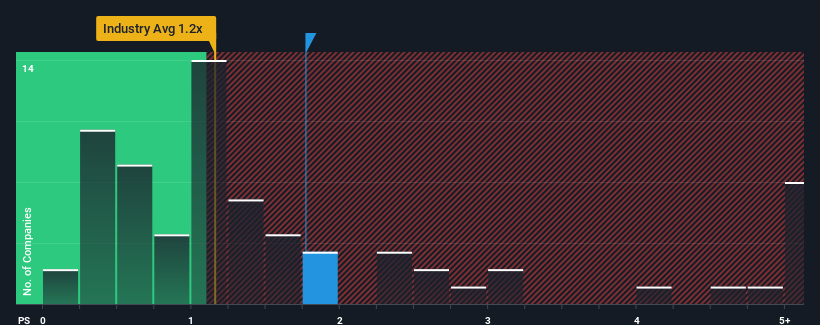
Since its price has surged higher, you could be forgiven for thinking enishinc is a stock not worth researching with a price-to-sales ratios (or "P/S") of 1.8x, considering almost half the companies in Japan's Entertainment industry have P/S ratios below 1.2x. Nonetheless, we'd need to dig a little deeper to determine if there is a rational basis for the elevated P/S.
Check out our latest analysis for enishinc
What Does enishinc's Recent Performance Look Like?
As an illustration, revenue has deteriorated at enishinc over the last year, which is not ideal at all. Perhaps the market believes the company can do enough to outperform the rest of the industry in the near future, which is keeping the P/S ratio high. However, if this isn't the case, investors might get caught out paying too much for the stock.
Although there are no analyst estimates available for enishinc, take a look at this free data-rich visualisation to see how the company stacks up on earnings, revenue and cash flow.Is There Enough Revenue Growth Forecasted For enishinc?
In order to justify its P/S ratio, enishinc would need to produce impressive growth in excess of the industry.
Retrospectively, the last year delivered a frustrating 15% decrease to the company's top line. This means it has also seen a slide in revenue over the longer-term as revenue is down 14% in total over the last three years. So unfortunately, we have to acknowledge that the company has not done a great job of growing revenue over that time.
Comparing that to the industry, which is predicted to shrink 0.09% in the next 12 months, the company's downward momentum is still inferior based on recent medium-term annualised revenue results.
With this in mind, we find it intriguing that enishinc's P/S exceeds that of its industry peers. In general, when revenue shrink rapidly the P/S premium often shrinks too, which could set up shareholders for future disappointment. Maintaining these prices will be extremely difficult to achieve as a continuation of recent revenue trends is likely to weigh down the shares eventually.
The Final Word
The large bounce in enishinc's shares has lifted the company's P/S handsomely. Generally, our preference is to limit the use of the price-to-sales ratio to establishing what the market thinks about the overall health of a company.
Our examination of enishinc revealed its sharp three-year contraction in revenue isn't impacting its high P/S anywhere near as much as we would have predicted, given the industry is set to shrink less severely. Right now we aren't comfortable with the high P/S as this revenue performance is unlikely to support such positive sentiment for long. We're also cautious about the company's ability to stay its recent medium-term course and resist even greater pain to its business from the broader industry turmoil. Unless the company's relative performance improves markedly, it's very challenging to accept these prices as being reasonable.
And what about other risks? Every company has them, and we've spotted 4 warning signs for enishinc (of which 2 are a bit concerning!) you should know about.
Of course, profitable companies with a history of great earnings growth are generally safer bets. So you may wish to see this free collection of other companies that have reasonable P/E ratios and have grown earnings strongly.
If you're looking to trade enishinc, open an account with the lowest-cost platform trusted by professionals, Interactive Brokers.
With clients in over 200 countries and territories, and access to 160 markets, IBKR lets you trade stocks, options, futures, forex, bonds and funds from a single integrated account.
Enjoy no hidden fees, no account minimums, and FX conversion rates as low as 0.03%, far better than what most brokers offer.
Sponsored ContentNew: Manage All Your Stock Portfolios in One Place
We've created the ultimate portfolio companion for stock investors, and it's free.
• Connect an unlimited number of Portfolios and see your total in one currency
• Be alerted to new Warning Signs or Risks via email or mobile
• Track the Fair Value of your stocks
Have feedback on this article? Concerned about the content? Get in touch with us directly. Alternatively, email editorial-team (at) simplywallst.com.
This article by Simply Wall St is general in nature. We provide commentary based on historical data and analyst forecasts only using an unbiased methodology and our articles are not intended to be financial advice. It does not constitute a recommendation to buy or sell any stock, and does not take account of your objectives, or your financial situation. We aim to bring you long-term focused analysis driven by fundamental data. Note that our analysis may not factor in the latest price-sensitive company announcements or qualitative material. Simply Wall St has no position in any stocks mentioned.
About TSE:3667
Adequate balance sheet slight.
Market Insights

Community Narratives

