
Advertisement
These 4 Measures Indicate That Yamato Industry (TSE:7886) Is Using Debt Extensively

The external fund manager backed by Berkshire Hathaway's Charlie Munger, Li Lu, makes no bones about it when he says 'The biggest investment risk is not the volatility of prices, but whether you will suffer a permanent loss of capital.' When we think about how risky a company is, we always like to look at its use of debt, since debt overload can lead to ruin. Importantly, Yamato Industry Co., Ltd. (TSE:7886) does carry debt. But should shareholders be worried about its use of debt?
When Is Debt A Problem?
Generally speaking, debt only becomes a real problem when a company can't easily pay it off, either by raising capital or with its own cash flow. If things get really bad, the lenders can take control of the business. However, a more common (but still painful) scenario is that it has to raise new equity capital at a low price, thus permanently diluting shareholders. Of course, the upside of debt is that it often represents cheap capital, especially when it replaces dilution in a company with the ability to reinvest at high rates of return. When we examine debt levels, we first consider both cash and debt levels, together.
View our latest analysis for Yamato Industry
What Is Yamato Industry's Net Debt?
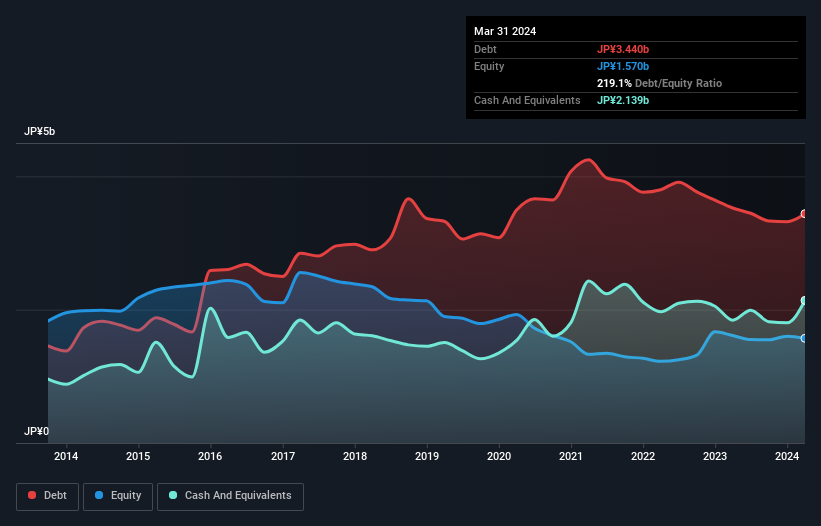
The chart below, which you can click on for greater detail, shows that Yamato Industry had JP¥3.44b in debt in March 2024; about the same as the year before. However, it does have JP¥2.14b in cash offsetting this, leading to net debt of about JP¥1.30b.
How Healthy Is Yamato Industry's Balance Sheet?
Zooming in on the latest balance sheet data, we can see that Yamato Industry had liabilities of JP¥4.33b due within 12 months and liabilities of JP¥2.68b due beyond that. Offsetting this, it had JP¥2.14b in cash and JP¥2.85b in receivables that were due within 12 months. So its liabilities total JP¥2.02b more than the combination of its cash and short-term receivables.
When you consider that this deficiency exceeds the company's JP¥1.56b market capitalization, you might well be inclined to review the balance sheet intently. In the scenario where the company had to clean up its balance sheet quickly, it seems likely shareholders would suffer extensive dilution.
We measure a company's debt load relative to its earnings power by looking at its net debt divided by its earnings before interest, tax, depreciation, and amortization (EBITDA) and by calculating how easily its earnings before interest and tax (EBIT) cover its interest expense (interest cover). This way, we consider both the absolute quantum of the debt, as well as the interest rates paid on it.
While we wouldn't worry about Yamato Industry's net debt to EBITDA ratio of 4.4, we think its super-low interest cover of 0.80 times is a sign of high leverage. It seems that the business incurs large depreciation and amortisation charges, so maybe its debt load is heavier than it would first appear, since EBITDA is arguably a generous measure of earnings. It seems clear that the cost of borrowing money is negatively impacting returns for shareholders, of late. Worse, Yamato Industry's EBIT was down 78% over the last year. If earnings keep going like that over the long term, it has a snowball's chance in hell of paying off that debt. When analysing debt levels, the balance sheet is the obvious place to start. But it is Yamato Industry's earnings that will influence how the balance sheet holds up in the future. So when considering debt, it's definitely worth looking at the earnings trend. Click here for an interactive snapshot.
Finally, a business needs free cash flow to pay off debt; accounting profits just don't cut it. So we clearly need to look at whether that EBIT is leading to corresponding free cash flow. Over the most recent two years, Yamato Industry recorded free cash flow worth 52% of its EBIT, which is around normal, given free cash flow excludes interest and tax. This free cash flow puts the company in a good position to pay down debt, when appropriate.
Our View
To be frank both Yamato Industry's interest cover and its track record of (not) growing its EBIT make us rather uncomfortable with its debt levels. Having said that, its ability to convert EBIT to free cash flow isn't such a worry. After considering the datapoints discussed, we think Yamato Industry has too much debt. That sort of riskiness is ok for some, but it certainly doesn't float our boat. When analysing debt levels, the balance sheet is the obvious place to start. However, not all investment risk resides within the balance sheet - far from it. We've identified 2 warning signs with Yamato Industry (at least 1 which makes us a bit uncomfortable) , and understanding them should be part of your investment process.
When all is said and done, sometimes its easier to focus on companies that don't even need debt. Readers can access a list of growth stocks with zero net debt 100% free, right now.
New: Manage All Your Stock Portfolios in One Place
We've created the ultimate portfolio companion for stock investors, and it's free.
• Connect an unlimited number of Portfolios and see your total in one currency
• Be alerted to new Warning Signs or Risks via email or mobile
• Track the Fair Value of your stocks
Have feedback on this article? Concerned about the content? Get in touch with us directly. Alternatively, email editorial-team (at) simplywallst.com.
This article by Simply Wall St is general in nature. We provide commentary based on historical data and analyst forecasts only using an unbiased methodology and our articles are not intended to be financial advice. It does not constitute a recommendation to buy or sell any stock, and does not take account of your objectives, or your financial situation. We aim to bring you long-term focused analysis driven by fundamental data. Note that our analysis may not factor in the latest price-sensitive company announcements or qualitative material. Simply Wall St has no position in any stocks mentioned.
Have feedback on this article? Concerned about the content? Get in touch with us directly. Alternatively, email editorial-team@simplywallst.com
About TSE:7886
Yamato Mobility & Mfg.Ltd
Primarily engages in the planning, design, manufacturing, and sale of injection molding products in Japan and internationally.
Adequate balance sheet and slightly overvalued.
Market Insights

Advertisement
Community Narratives
WhiteCap Is Positioned To Profit Regardless Of Trump's Policy 
Fair Value CA$22.60|61.6% undervalued
ST
Equity Analyst and Writer
Microsoft's Evolution Will Drive Revenue to New Heights Fueled by AI
Fair Value US$360.00|28.3% overvalued
BR
Community Contributor
A CASE FOR USD$2.50 (CAD$3.44) BY 2028 (A 5-10 BAGGER)
Fair Value CA$3.44|87.8% undervalued
AG
Community Contributor