
Advertisement
David Iben put it well when he said, 'Volatility is not a risk we care about. What we care about is avoiding the permanent loss of capital.' So it seems the smart money knows that debt - which is usually involved in bankruptcies - is a very important factor, when you assess how risky a company is. Importantly, Tokyo Board Industries Co., Ltd. (TSE:7815) does carry debt. But the real question is whether this debt is making the company risky.
What Risk Does Debt Bring?
Debt is a tool to help businesses grow, but if a business is incapable of paying off its lenders, then it exists at their mercy. If things get really bad, the lenders can take control of the business. However, a more usual (but still expensive) situation is where a company must dilute shareholders at a cheap share price simply to get debt under control. Having said that, the most common situation is where a company manages its debt reasonably well - and to its own advantage. The first step when considering a company's debt levels is to consider its cash and debt together.
See our latest analysis for Tokyo Board Industries
What Is Tokyo Board Industries's Net Debt?
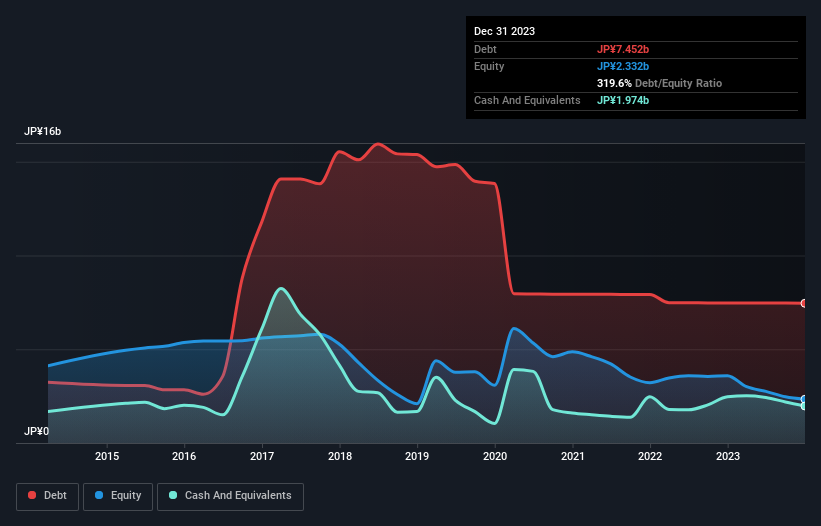
As you can see below, Tokyo Board Industries had JP¥7.45b of debt, at December 2023, which is about the same as the year before. You can click the chart for greater detail. However, because it has a cash reserve of JP¥1.97b, its net debt is less, at about JP¥5.48b.
How Healthy Is Tokyo Board Industries' Balance Sheet?
According to the last reported balance sheet, Tokyo Board Industries had liabilities of JP¥6.32b due within 12 months, and liabilities of JP¥3.63b due beyond 12 months. On the other hand, it had cash of JP¥1.97b and JP¥1.67b worth of receivables due within a year. So its liabilities outweigh the sum of its cash and (near-term) receivables by JP¥6.31b.
The deficiency here weighs heavily on the JP¥2.38b company itself, as if a child were struggling under the weight of an enormous back-pack full of books, his sports gear, and a trumpet. So we definitely think shareholders need to watch this one closely. After all, Tokyo Board Industries would likely require a major re-capitalisation if it had to pay its creditors today. There's no doubt that we learn most about debt from the balance sheet. But it is Tokyo Board Industries's earnings that will influence how the balance sheet holds up in the future. So if you're keen to discover more about its earnings, it might be worth checking out this graph of its long term earnings trend.
Over 12 months, Tokyo Board Industries made a loss at the EBIT level, and saw its revenue drop to JP¥6.6b, which is a fall of 27%. That makes us nervous, to say the least.
Caveat Emptor
Not only did Tokyo Board Industries's revenue slip over the last twelve months, but it also produced negative earnings before interest and tax (EBIT). Its EBIT loss was a whopping JP¥1.2b. If you consider the significant liabilities mentioned above, we are extremely wary of this investment. Of course, it may be able to improve its situation with a bit of luck and good execution. But we think that is unlikely since it is low on liquid assets, and made a loss of JP¥1.3b in the last year. So while it's not wise to assume the company will fail, we do think it's risky. There's no doubt that we learn most about debt from the balance sheet. But ultimately, every company can contain risks that exist outside of the balance sheet. These risks can be hard to spot. Every company has them, and we've spotted 3 warning signs for Tokyo Board Industries (of which 2 make us uncomfortable!) you should know about.
At the end of the day, it's often better to focus on companies that are free from net debt. You can access our special list of such companies (all with a track record of profit growth). It's free.
Valuation is complex, but we're here to simplify it.
Discover if Tokyo Board Industries might be undervalued or overvalued with our detailed analysis, featuring fair value estimates, potential risks, dividends, insider trades, and its financial condition.
Access Free AnalysisHave feedback on this article? Concerned about the content? Get in touch with us directly. Alternatively, email editorial-team (at) simplywallst.com.
This article by Simply Wall St is general in nature. We provide commentary based on historical data and analyst forecasts only using an unbiased methodology and our articles are not intended to be financial advice. It does not constitute a recommendation to buy or sell any stock, and does not take account of your objectives, or your financial situation. We aim to bring you long-term focused analysis driven by fundamental data. Note that our analysis may not factor in the latest price-sensitive company announcements or qualitative material. Simply Wall St has no position in any stocks mentioned.
About TSE:7815
Tokyo Board Industries
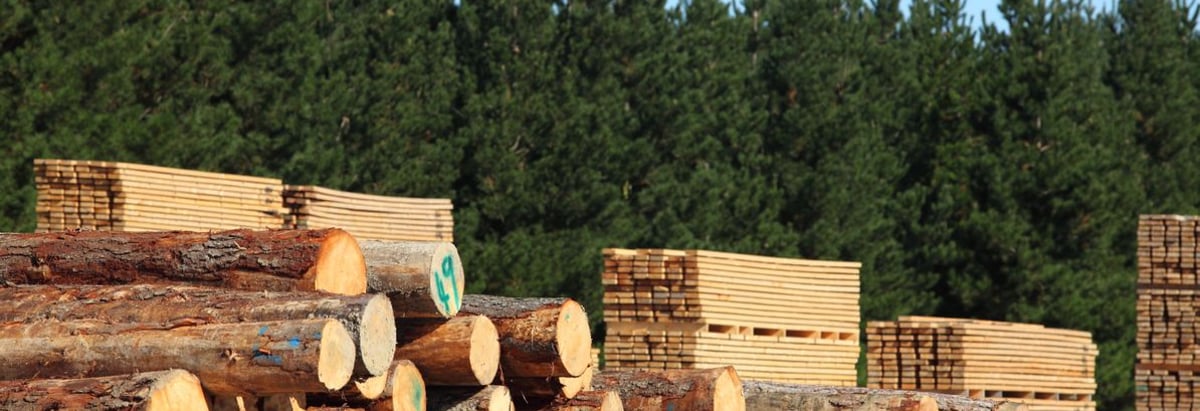
Processes, manufactures, and sells wood chips using industrial and general waste in Japan.
Low and slightly overvalued.
Market Insights

Advertisement
Community Narratives

BMW cruising ahead with new EVs and premium models to boost revenue 5%
Fair Value €135.07|45.0% undervalued
UN
Community Contributor
EU#2 - From Humble Beginnings to Global Powerhouse
Fair Value DKK 851.04|47.8% undervalued
TO
Community Contributor