- Japan
- /
- Metals and Mining
- /
- TSE:5726
OSAKA Titanium technologiesLtd (TSE:5726) pulls back 9.4% this week, but still delivers shareholders strong 44% CAGR over 3 years


OSAKA Titanium technologies Co.,Ltd. (TSE:5726) shareholders have seen the share price descend 11% over the month. In contrast, the return over three years has been impressive. In three years the stock price has launched 185% higher: a great result. After a run like that some may not be surprised to see prices moderate. If the business can perform well for years to come, then the recent drop could be an opportunity.
While the stock has fallen 9.4% this week, it's worth focusing on the longer term and seeing if the stocks historical returns have been driven by the underlying fundamentals.
View our latest analysis for OSAKA Titanium technologiesLtd
There is no denying that markets are sometimes efficient, but prices do not always reflect underlying business performance. One way to examine how market sentiment has changed over time is to look at the interaction between a company's share price and its earnings per share (EPS).
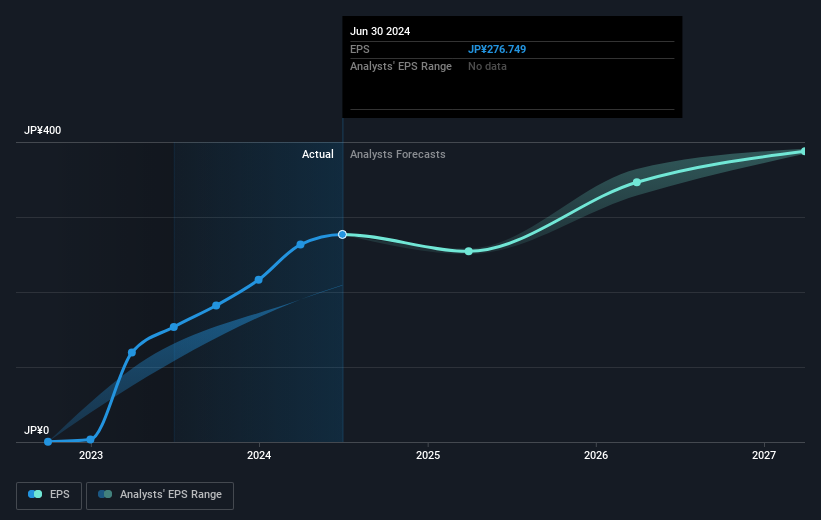
During three years of share price growth, OSAKA Titanium technologiesLtd moved from a loss to profitability. Given the importance of this milestone, it's not overly surprising that the share price has increased strongly.
The image below shows how EPS has tracked over time (if you click on the image you can see greater detail).
We know that OSAKA Titanium technologiesLtd has improved its bottom line over the last three years, but what does the future have in store? This free interactive report on OSAKA Titanium technologiesLtd's balance sheet strength is a great place to start, if you want to investigate the stock further.
What About Dividends?
When looking at investment returns, it is important to consider the difference between total shareholder return (TSR) and share price return. Whereas the share price return only reflects the change in the share price, the TSR includes the value of dividends (assuming they were reinvested) and the benefit of any discounted capital raising or spin-off. So for companies that pay a generous dividend, the TSR is often a lot higher than the share price return. We note that for OSAKA Titanium technologiesLtd the TSR over the last 3 years was 199%, which is better than the share price return mentioned above. And there's no prize for guessing that the dividend payments largely explain the divergence!
A Different Perspective
Investors in OSAKA Titanium technologiesLtd had a tough year, with a total loss of 26% (including dividends), against a market gain of about 19%. Even the share prices of good stocks drop sometimes, but we want to see improvements in the fundamental metrics of a business, before getting too interested. On the bright side, long term shareholders have made money, with a gain of 7% per year over half a decade. It could be that the recent sell-off is an opportunity, so it may be worth checking the fundamental data for signs of a long term growth trend. It's always interesting to track share price performance over the longer term. But to understand OSAKA Titanium technologiesLtd better, we need to consider many other factors. Case in point: We've spotted 3 warning signs for OSAKA Titanium technologiesLtd you should be aware of, and 1 of them doesn't sit too well with us.
For those who like to find winning investments this free list of undervalued companies with recent insider purchasing, could be just the ticket.
Please note, the market returns quoted in this article reflect the market weighted average returns of stocks that currently trade on Japanese exchanges.
New: AI Stock Screener & Alerts
Our new AI Stock Screener scans the market every day to uncover opportunities.
• Dividend Powerhouses (3%+ Yield)
• Undervalued Small Caps with Insider Buying
• High growth Tech and AI Companies
Or build your own from over 50 metrics.
Have feedback on this article? Concerned about the content? Get in touch with us directly. Alternatively, email editorial-team (at) simplywallst.com.
This article by Simply Wall St is general in nature. We provide commentary based on historical data and analyst forecasts only using an unbiased methodology and our articles are not intended to be financial advice. It does not constitute a recommendation to buy or sell any stock, and does not take account of your objectives, or your financial situation. We aim to bring you long-term focused analysis driven by fundamental data. Note that our analysis may not factor in the latest price-sensitive company announcements or qualitative material. Simply Wall St has no position in any stocks mentioned.
About TSE:5726
Undervalued with solid track record.
