- Japan
- /
- Metals and Mining
- /
- TSE:5610
Daiwa Heavy Industry Co., Ltd. (TSE:5610) Soars 40% But It's A Story Of Risk Vs Reward


Daiwa Heavy Industry Co., Ltd. (TSE:5610) shares have had a really impressive month, gaining 40% after a shaky period beforehand. Not all shareholders will be feeling jubilant, since the share price is still down a very disappointing 15% in the last twelve months.
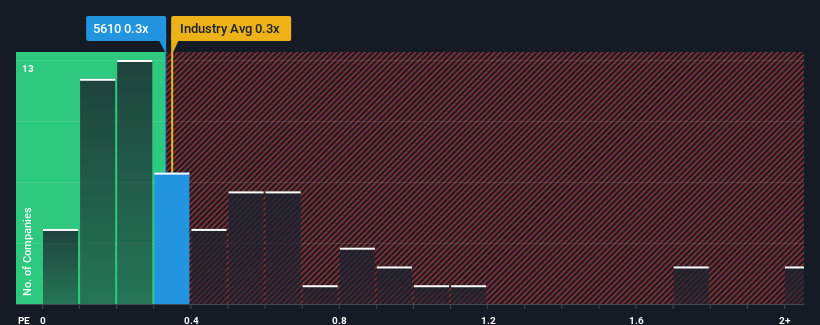
Although its price has surged higher, you could still be forgiven for feeling indifferent about Daiwa Heavy Industry's P/S ratio of 0.3x, since the median price-to-sales (or "P/S") ratio for the Metals and Mining industry in Japan is about the same. While this might not raise any eyebrows, if the P/S ratio is not justified investors could be missing out on a potential opportunity or ignoring looming disappointment.
View our latest analysis for Daiwa Heavy Industry
How Daiwa Heavy Industry Has Been Performing
The revenue growth achieved at Daiwa Heavy Industry over the last year would be more than acceptable for most companies. One possibility is that the P/S is moderate because investors think this respectable revenue growth might not be enough to outperform the broader industry in the near future. Those who are bullish on Daiwa Heavy Industry will be hoping that this isn't the case, so that they can pick up the stock at a lower valuation.
We don't have analyst forecasts, but you can see how recent trends are setting up the company for the future by checking out our free report on Daiwa Heavy Industry's earnings, revenue and cash flow.Is There Some Revenue Growth Forecasted For Daiwa Heavy Industry?
Daiwa Heavy Industry's P/S ratio would be typical for a company that's only expected to deliver moderate growth, and importantly, perform in line with the industry.
Taking a look back first, we see that the company managed to grow revenues by a handy 12% last year. Pleasingly, revenue has also lifted 59% in aggregate from three years ago, partly thanks to the last 12 months of growth. So we can start by confirming that the company has done a great job of growing revenues over that time.
Comparing that to the industry, which is only predicted to deliver 4.8% growth in the next 12 months, the company's momentum is stronger based on recent medium-term annualised revenue results.
With this information, we find it interesting that Daiwa Heavy Industry is trading at a fairly similar P/S compared to the industry. Apparently some shareholders believe the recent performance is at its limits and have been accepting lower selling prices.
The Final Word
Daiwa Heavy Industry appears to be back in favour with a solid price jump bringing its P/S back in line with other companies in the industry Using the price-to-sales ratio alone to determine if you should sell your stock isn't sensible, however it can be a practical guide to the company's future prospects.
We didn't quite envision Daiwa Heavy Industry's P/S sitting in line with the wider industry, considering the revenue growth over the last three-year is higher than the current industry outlook. There could be some unobserved threats to revenue preventing the P/S ratio from matching this positive performance. It appears some are indeed anticipating revenue instability, because the persistence of these recent medium-term conditions would normally provide a boost to the share price.
Don't forget that there may be other risks. For instance, we've identified 3 warning signs for Daiwa Heavy Industry (1 can't be ignored) you should be aware of.
If companies with solid past earnings growth is up your alley, you may wish to see this free collection of other companies with strong earnings growth and low P/E ratios.
New: Manage All Your Stock Portfolios in One Place
We've created the ultimate portfolio companion for stock investors, and it's free.
• Connect an unlimited number of Portfolios and see your total in one currency
• Be alerted to new Warning Signs or Risks via email or mobile
• Track the Fair Value of your stocks
Have feedback on this article? Concerned about the content? Get in touch with us directly. Alternatively, email editorial-team (at) simplywallst.com.
This article by Simply Wall St is general in nature. We provide commentary based on historical data and analyst forecasts only using an unbiased methodology and our articles are not intended to be financial advice. It does not constitute a recommendation to buy or sell any stock, and does not take account of your objectives, or your financial situation. We aim to bring you long-term focused analysis driven by fundamental data. Note that our analysis may not factor in the latest price-sensitive company announcements or qualitative material. Simply Wall St has no position in any stocks mentioned.
About TSE:5610
Daiwa Heavy Industry
Manufactures and sells various products for industrial machinery and housing equipment in Japan.
Mediocre balance sheet very low.
Market Insights

Community Narratives


