
Advertisement
The Price Is Right For Mipox Corporation (TSE:5381) Even After Diving 38%
The Mipox Corporation (TSE:5381) share price has fared very poorly over the last month, falling by a substantial 38%. The drop over the last 30 days has capped off a tough year for shareholders, with the share price down 49% in that time.
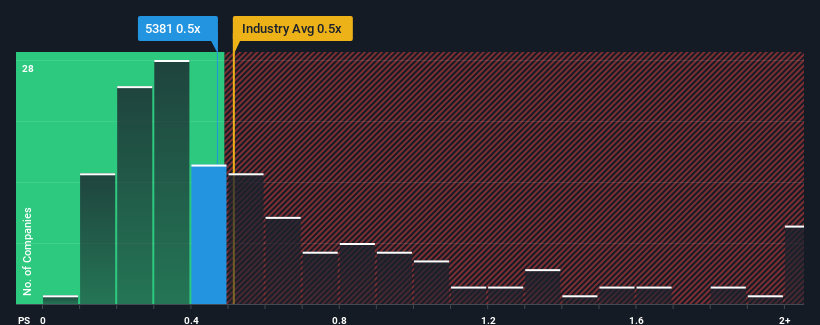
Although its price has dipped substantially, you could still be forgiven for feeling indifferent about Mipox's P/S ratio of 0.5x, since the median price-to-sales (or "P/S") ratio for the Chemicals industry in Japan is about the same. Although, it's not wise to simply ignore the P/S without explanation as investors may be disregarding a distinct opportunity or a costly mistake.
Check out our latest analysis for Mipox
What Does Mipox's Recent Performance Look Like?
For instance, Mipox's receding revenue in recent times would have to be some food for thought. One possibility is that the P/S is moderate because investors think the company might still do enough to be in line with the broader industry in the near future. If you like the company, you'd at least be hoping this is the case so that you could potentially pick up some stock while it's not quite in favour.
Want the full picture on earnings, revenue and cash flow for the company? Then our free report on Mipox will help you shine a light on its historical performance.What Are Revenue Growth Metrics Telling Us About The P/S?
Mipox's P/S ratio would be typical for a company that's only expected to deliver moderate growth, and importantly, perform in line with the industry.
Retrospectively, the last year delivered a frustrating 6.7% decrease to the company's top line. That put a dampener on the good run it was having over the longer-term as its three-year revenue growth is still a noteworthy 27% in total. Accordingly, while they would have preferred to keep the run going, shareholders would be roughly satisfied with the medium-term rates of revenue growth.
Comparing that to the industry, which is predicted to deliver 6.9% growth in the next 12 months, the company's momentum is pretty similar based on recent medium-term annualised revenue results.
With this in consideration, it's clear to see why Mipox's P/S matches up closely to its industry peers. Apparently shareholders are comfortable to simply hold on assuming the company will continue keeping a low profile.
The Key Takeaway
With its share price dropping off a cliff, the P/S for Mipox looks to be in line with the rest of the Chemicals industry. It's argued the price-to-sales ratio is an inferior measure of value within certain industries, but it can be a powerful business sentiment indicator.
As we've seen, Mipox's three-year revenue trends seem to be contributing to its P/S, given they look similar to current industry expectations. Currently, with a past revenue trend that aligns closely wit the industry outlook, shareholders are confident the company's future revenue outlook won't contain any major surprises. If recent medium-term revenue trends continue, it's hard to see the share price moving strongly in either direction in the near future under these circumstances.
Before you settle on your opinion, we've discovered 3 warning signs for Mipox (1 shouldn't be ignored!) that you should be aware of.
If strong companies turning a profit tickle your fancy, then you'll want to check out this free list of interesting companies that trade on a low P/E (but have proven they can grow earnings).
New: Manage All Your Stock Portfolios in One Place
We've created the ultimate portfolio companion for stock investors, and it's free.
• Connect an unlimited number of Portfolios and see your total in one currency
• Be alerted to new Warning Signs or Risks via email or mobile
• Track the Fair Value of your stocks
Have feedback on this article? Concerned about the content? Get in touch with us directly. Alternatively, email editorial-team (at) simplywallst.com.
This article by Simply Wall St is general in nature. We provide commentary based on historical data and analyst forecasts only using an unbiased methodology and our articles are not intended to be financial advice. It does not constitute a recommendation to buy or sell any stock, and does not take account of your objectives, or your financial situation. We aim to bring you long-term focused analysis driven by fundamental data. Note that our analysis may not factor in the latest price-sensitive company announcements or qualitative material. Simply Wall St has no position in any stocks mentioned.
Have feedback on this article? Concerned about the content? Get in touch with us directly. Alternatively, email editorial-team@simplywallst.com
About TSE:5381
Solid track record with excellent balance sheet and pays a dividend.
Market Insights

Advertisement
Community Narratives
The Next Phase of Energy Storage: How NeoVolta Is Tackling America’s Power Crunch
Fair Value US$7.50|35.1% undervalued
MA
Community Contributor
Why EnSilica is Worth Possibly 13x its Current Price
Fair Value UK£5.00|89.8% undervalued
DO
Community Contributor
M&A Activity, Industry Diversification & A Defense Contract Monopoly Will Push BWXT For Healthy Long-Term Growth
Fair Value US$220.00|15.2% undervalued
CL
Community Contributor
A case for Cassiar Gold Corp (TSXV: GLDC) to reach CAD$8-10 before 2030 (X30-37)
Fair Value CA$10.00|96.0% undervalued
AG
Community Contributor