What Nihon Yamamura Glass Co., Ltd.'s (TSE:5210) 25% Share Price Gain Is Not Telling You

Nihon Yamamura Glass Co., Ltd. (TSE:5210) shareholders would be excited to see that the share price has had a great month, posting a 25% gain and recovering from prior weakness. The annual gain comes to 108% following the latest surge, making investors sit up and take notice.
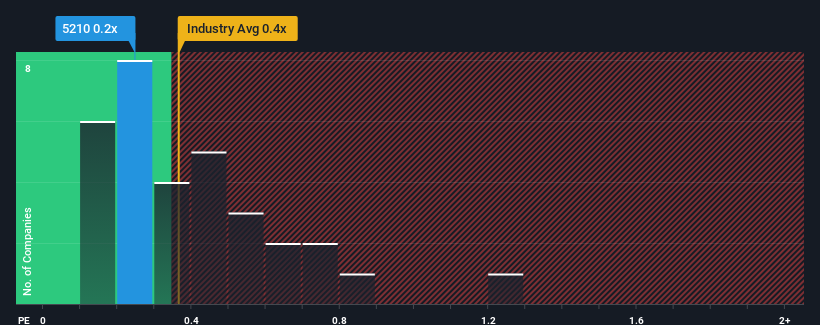
Although its price has surged higher, you could still be forgiven for feeling indifferent about Nihon Yamamura Glass' P/S ratio of 0.2x, since the median price-to-sales (or "P/S") ratio for the Packaging industry in Japan is also close to 0.4x. However, investors might be overlooking a clear opportunity or potential setback if there is no rational basis for the P/S.
See our latest analysis for Nihon Yamamura Glass
How Has Nihon Yamamura Glass Performed Recently?
The recent revenue growth at Nihon Yamamura Glass would have to be considered satisfactory if not spectacular. One possibility is that the P/S is moderate because investors think this good revenue growth might only be parallel to the broader industry in the near future. If not, then at least existing shareholders probably aren't too pessimistic about the future direction of the share price.
We don't have analyst forecasts, but you can see how recent trends are setting up the company for the future by checking out our free report on Nihon Yamamura Glass' earnings, revenue and cash flow.Is There Some Revenue Growth Forecasted For Nihon Yamamura Glass?
There's an inherent assumption that a company should be matching the industry for P/S ratios like Nihon Yamamura Glass' to be considered reasonable.
Retrospectively, the last year delivered a decent 7.0% gain to the company's revenues. Revenue has also lifted 28% in aggregate from three years ago, partly thanks to the last 12 months of growth. Therefore, it's fair to say the revenue growth recently has been respectable for the company.
Comparing the recent medium-term revenue trends against the industry's one-year growth forecast of 21% shows it's noticeably less attractive.
With this in mind, we find it intriguing that Nihon Yamamura Glass' P/S is comparable to that of its industry peers. Apparently many investors in the company are less bearish than recent times would indicate and aren't willing to let go of their stock right now. Maintaining these prices will be difficult to achieve as a continuation of recent revenue trends is likely to weigh down the shares eventually.
The Final Word
Nihon Yamamura Glass appears to be back in favour with a solid price jump bringing its P/S back in line with other companies in the industry We'd say the price-to-sales ratio's power isn't primarily as a valuation instrument but rather to gauge current investor sentiment and future expectations.
We've established that Nihon Yamamura Glass' average P/S is a bit surprising since its recent three-year growth is lower than the wider industry forecast. When we see weak revenue with slower than industry growth, we suspect the share price is at risk of declining, bringing the P/S back in line with expectations. If recent medium-term revenue trends continue, the probability of a share price decline will become quite substantial, placing shareholders at risk.
Plus, you should also learn about these 3 warning signs we've spotted with Nihon Yamamura Glass (including 1 which is potentially serious).
If you're unsure about the strength of Nihon Yamamura Glass' business, why not explore our interactive list of stocks with solid business fundamentals for some other companies you may have missed.
Valuation is complex, but we're here to simplify it.
Discover if Nihon Yamamura Glass might be undervalued or overvalued with our detailed analysis, featuring fair value estimates, potential risks, dividends, insider trades, and its financial condition.
Access Free AnalysisHave feedback on this article? Concerned about the content? Get in touch with us directly. Alternatively, email editorial-team (at) simplywallst.com.
This article by Simply Wall St is general in nature. We provide commentary based on historical data and analyst forecasts only using an unbiased methodology and our articles are not intended to be financial advice. It does not constitute a recommendation to buy or sell any stock, and does not take account of your objectives, or your financial situation. We aim to bring you long-term focused analysis driven by fundamental data. Note that our analysis may not factor in the latest price-sensitive company announcements or qualitative material. Simply Wall St has no position in any stocks mentioned.
About TSE:5210
Nihon Yamamura Glass
Produces and sells glass bottles and plastic closures in Japan and internationally.
Flawless balance sheet, good value and pays a dividend.
Market Insights

Community Narratives

