
Advertisement
Some Nihon Yamamura Glass Co., Ltd. (TSE:5210) Shareholders Look For Exit As Shares Take 31% Pounding
Nihon Yamamura Glass Co., Ltd. (TSE:5210) shares have had a horrible month, losing 31% after a relatively good period beforehand. The recent drop has obliterated the annual return, with the share price now down 8.2% over that longer period.
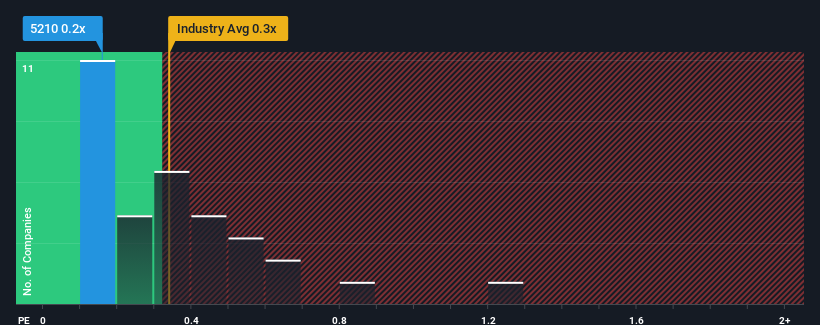
In spite of the heavy fall in price, you could still be forgiven for feeling indifferent about Nihon Yamamura Glass' P/S ratio of 0.2x, since the median price-to-sales (or "P/S") ratio for the Packaging industry in Japan is also close to 0.3x. However, investors might be overlooking a clear opportunity or potential setback if there is no rational basis for the P/S.
View our latest analysis for Nihon Yamamura Glass
How Nihon Yamamura Glass Has Been Performing
Nihon Yamamura Glass has been doing a decent job lately as it's been growing revenue at a reasonable pace. Perhaps the expectation moving forward is that the revenue growth will track in line with the wider industry for the near term, which has kept the P/S subdued. If you like the company, you'd be hoping this isn't the case so that you could potentially pick up some stock while it's not quite in favour.
Want the full picture on earnings, revenue and cash flow for the company? Then our free report on Nihon Yamamura Glass will help you shine a light on its historical performance.Do Revenue Forecasts Match The P/S Ratio?
Nihon Yamamura Glass' P/S ratio would be typical for a company that's only expected to deliver moderate growth, and importantly, perform in line with the industry.
Taking a look back first, we see that the company managed to grow revenues by a handy 7.0% last year. The latest three year period has also seen a 28% overall rise in revenue, aided somewhat by its short-term performance. Accordingly, shareholders would have probably been satisfied with the medium-term rates of revenue growth.
Comparing the recent medium-term revenue trends against the industry's one-year growth forecast of 26% shows it's noticeably less attractive.
In light of this, it's curious that Nihon Yamamura Glass' P/S sits in line with the majority of other companies. It seems most investors are ignoring the fairly limited recent growth rates and are willing to pay up for exposure to the stock. They may be setting themselves up for future disappointment if the P/S falls to levels more in line with recent growth rates.
What Does Nihon Yamamura Glass' P/S Mean For Investors?
With its share price dropping off a cliff, the P/S for Nihon Yamamura Glass looks to be in line with the rest of the Packaging industry. We'd say the price-to-sales ratio's power isn't primarily as a valuation instrument but rather to gauge current investor sentiment and future expectations.
We've established that Nihon Yamamura Glass' average P/S is a bit surprising since its recent three-year growth is lower than the wider industry forecast. Right now we are uncomfortable with the P/S as this revenue performance isn't likely to support a more positive sentiment for long. Unless the recent medium-term conditions improve, it's hard to accept the current share price as fair value.
We don't want to rain on the parade too much, but we did also find 4 warning signs for Nihon Yamamura Glass (1 is concerning!) that you need to be mindful of.
If these risks are making you reconsider your opinion on Nihon Yamamura Glass, explore our interactive list of high quality stocks to get an idea of what else is out there.
Valuation is complex, but we're here to simplify it.
Discover if Nihon Yamamura Glass might be undervalued or overvalued with our detailed analysis, featuring fair value estimates, potential risks, dividends, insider trades, and its financial condition.
Access Free AnalysisHave feedback on this article? Concerned about the content? Get in touch with us directly. Alternatively, email editorial-team (at) simplywallst.com.
This article by Simply Wall St is general in nature. We provide commentary based on historical data and analyst forecasts only using an unbiased methodology and our articles are not intended to be financial advice. It does not constitute a recommendation to buy or sell any stock, and does not take account of your objectives, or your financial situation. We aim to bring you long-term focused analysis driven by fundamental data. Note that our analysis may not factor in the latest price-sensitive company announcements or qualitative material. Simply Wall St has no position in any stocks mentioned.
Have feedback on this article? Concerned about the content? Get in touch with us directly. Alternatively, email editorial-team@simplywallst.com
About TSE:5210
Nihon Yamamura Glass
Produces and sells glass bottles and plastic closures in Japan and internationally.
Flawless balance sheet, good value and pays a dividend.
Market Insights

Advertisement
Community Narratives

BMW cruising ahead with new EVs and premium models to boost revenue 5%
Fair Value €135.07|44.6% undervalued
UN
Community Contributor
EU#2 - From Humble Beginnings to Global Powerhouse
Fair Value DKK 851.04|46.4% undervalued
TO
Community Contributor