
Advertisement
Nihon Nohyaku (TSE:4997) investors are up 10% in the past week, but earnings have declined over the last three years

Buying a low-cost index fund will get you the average market return. But in any diversified portfolio of stocks, you'll see some that fall short of the average. Unfortunately for shareholders, while the Nihon Nohyaku Co., Ltd. (TSE:4997) share price is up 22% in the last three years, that falls short of the market return. Zooming in, the stock is up just 3.4% in the last year.
Since the stock has added JP¥4.8b to its market cap in the past week alone, let's see if underlying performance has been driving long-term returns.
View our latest analysis for Nihon Nohyaku
While markets are a powerful pricing mechanism, share prices reflect investor sentiment, not just underlying business performance. One imperfect but simple way to consider how the market perception of a company has shifted is to compare the change in the earnings per share (EPS) with the share price movement.
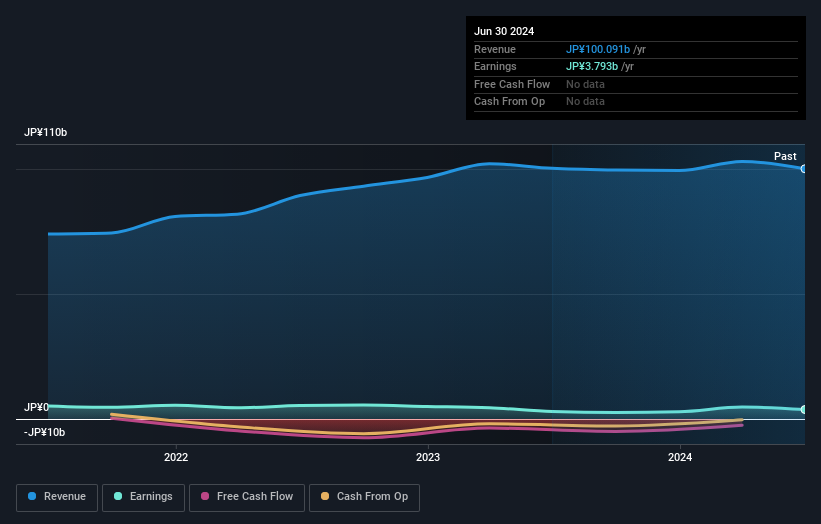
During the three years of share price growth, Nihon Nohyaku actually saw its earnings per share (EPS) drop 10% per year.
This means it's unlikely the market is judging the company based on earnings growth. Since the change in EPS doesn't seem to correlate with the change in share price, it's worth taking a look at other metrics.
It may well be that Nihon Nohyaku revenue growth rate of 11% over three years has convinced shareholders to believe in a brighter future. In that case, the company may be sacrificing current earnings per share to drive growth, and maybe shareholder's faith in better days ahead will be rewarded.
You can see how earnings and revenue have changed over time in the image below (click on the chart to see the exact values).
Take a more thorough look at Nihon Nohyaku's financial health with this free report on its balance sheet.
What About Dividends?
When looking at investment returns, it is important to consider the difference between total shareholder return (TSR) and share price return. Whereas the share price return only reflects the change in the share price, the TSR includes the value of dividends (assuming they were reinvested) and the benefit of any discounted capital raising or spin-off. It's fair to say that the TSR gives a more complete picture for stocks that pay a dividend. We note that for Nihon Nohyaku the TSR over the last 3 years was 32%, which is better than the share price return mentioned above. And there's no prize for guessing that the dividend payments largely explain the divergence!
A Different Perspective
Nihon Nohyaku shareholders are up 6.3% for the year (even including dividends). But that return falls short of the market. The silver lining is that the gain was actually better than the average annual return of 5% per year over five year. It is possible that returns will improve along with the business fundamentals. While it is well worth considering the different impacts that market conditions can have on the share price, there are other factors that are even more important. Even so, be aware that Nihon Nohyaku is showing 1 warning sign in our investment analysis , you should know about...
We will like Nihon Nohyaku better if we see some big insider buys. While we wait, check out this free list of undervalued stocks (mostly small caps) with considerable, recent, insider buying.
Please note, the market returns quoted in this article reflect the market weighted average returns of stocks that currently trade on Japanese exchanges.
Valuation is complex, but we're here to simplify it.
Discover if Nihon Nohyaku might be undervalued or overvalued with our detailed analysis, featuring fair value estimates, potential risks, dividends, insider trades, and its financial condition.
Access Free AnalysisHave feedback on this article? Concerned about the content? Get in touch with us directly. Alternatively, email editorial-team (at) simplywallst.com.
This article by Simply Wall St is general in nature. We provide commentary based on historical data and analyst forecasts only using an unbiased methodology and our articles are not intended to be financial advice. It does not constitute a recommendation to buy or sell any stock, and does not take account of your objectives, or your financial situation. We aim to bring you long-term focused analysis driven by fundamental data. Note that our analysis may not factor in the latest price-sensitive company announcements or qualitative material. Simply Wall St has no position in any stocks mentioned.
About TSE:4997
Nihon Nohyaku
Manufactures and sells agrochemicals in Japan and internationally.
Excellent balance sheet average dividend payer.
Market Insights


Advertisement
Community Narratives
MicroStrategy: Volatile Gamble or Golden Opportunity?
Fair Value US$663.00|33.3% undervalued
BL
Community Contributor
Emerging Markets and Debt Reduction Will Propel Bath & Body Works Forward
Fair Value US$40.73|23.4% undervalued
ZW
Community Contributor
An amazing opportunity to potentially get a 100 bagger
Fair Value US$10.00|8.5% overvalued
DA
Community Contributor