
Advertisement
Warren Buffett famously said, 'Volatility is far from synonymous with risk.' So it seems the smart money knows that debt - which is usually involved in bankruptcies - is a very important factor, when you assess how risky a company is. We can see that artience Co., Ltd. (TSE:4634) does use debt in its business. But the more important question is: how much risk is that debt creating?
What Risk Does Debt Bring?
Debt and other liabilities become risky for a business when it cannot easily fulfill those obligations, either with free cash flow or by raising capital at an attractive price. Part and parcel of capitalism is the process of 'creative destruction' where failed businesses are mercilessly liquidated by their bankers. However, a more frequent (but still costly) occurrence is where a company must issue shares at bargain-basement prices, permanently diluting shareholders, just to shore up its balance sheet. Of course, plenty of companies use debt to fund growth, without any negative consequences. The first thing to do when considering how much debt a business uses is to look at its cash and debt together.
What Is artience's Debt?
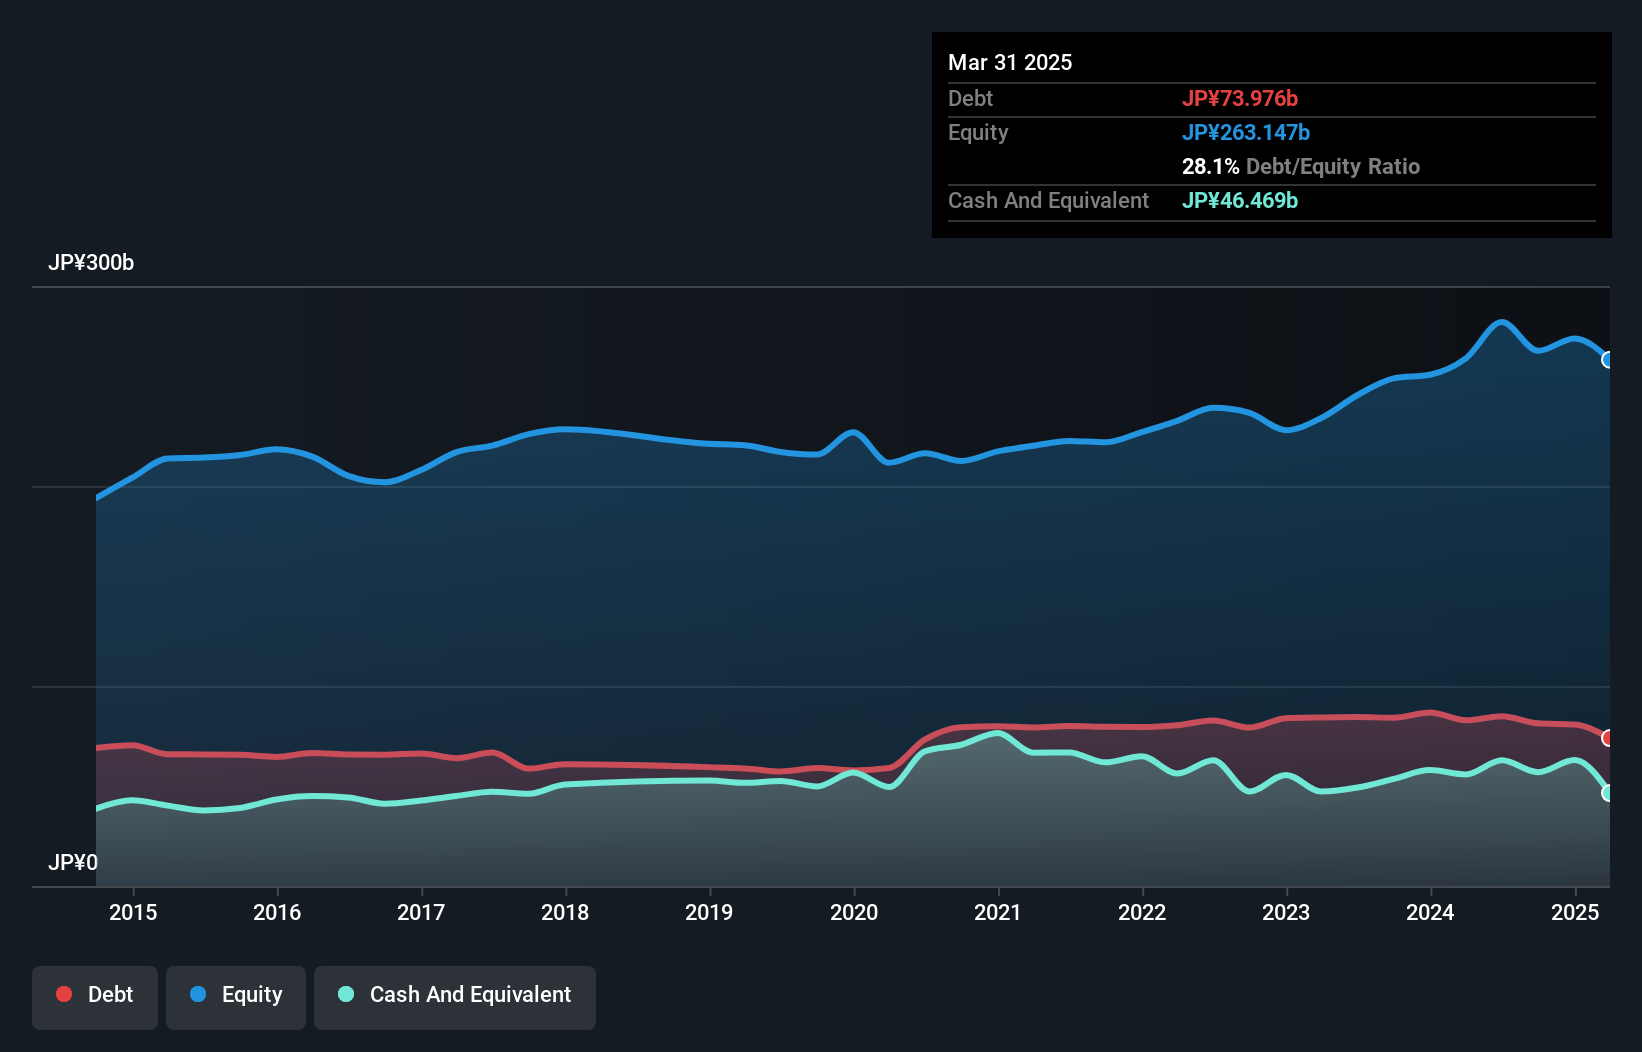
You can click the graphic below for the historical numbers, but it shows that artience had JP¥74.0b of debt in March 2025, down from JP¥82.9b, one year before. However, it also had JP¥46.5b in cash, and so its net debt is JP¥27.5b.
A Look At artience's Liabilities
Zooming in on the latest balance sheet data, we can see that artience had liabilities of JP¥115.6b due within 12 months and liabilities of JP¥63.5b due beyond that. Offsetting this, it had JP¥46.5b in cash and JP¥101.1b in receivables that were due within 12 months. So its liabilities total JP¥31.5b more than the combination of its cash and short-term receivables.
Of course, artience has a market capitalization of JP¥164.4b, so these liabilities are probably manageable. Having said that, it's clear that we should continue to monitor its balance sheet, lest it change for the worse.
See our latest analysis for artience
We measure a company's debt load relative to its earnings power by looking at its net debt divided by its earnings before interest, tax, depreciation, and amortization (EBITDA) and by calculating how easily its earnings before interest and tax (EBIT) cover its interest expense (interest cover). The advantage of this approach is that we take into account both the absolute quantum of debt (with net debt to EBITDA) and the actual interest expenses associated with that debt (with its interest cover ratio).
artience's net debt is only 0.84 times its EBITDA. And its EBIT easily covers its interest expense, being 27.9 times the size. So you could argue it is no more threatened by its debt than an elephant is by a mouse. Another good sign is that artience has been able to increase its EBIT by 30% in twelve months, making it easier to pay down debt. The balance sheet is clearly the area to focus on when you are analysing debt. But ultimately the future profitability of the business will decide if artience can strengthen its balance sheet over time. So if you're focused on the future you can check out this free report showing analyst profit forecasts.
Finally, a company can only pay off debt with cold hard cash, not accounting profits. So we always check how much of that EBIT is translated into free cash flow. Over the last three years, artience reported free cash flow worth 10% of its EBIT, which is really quite low. That limp level of cash conversion undermines its ability to manage and pay down debt.
Our View
artience's interest cover suggests it can handle its debt as easily as Cristiano Ronaldo could score a goal against an under 14's goalkeeper. But the stark truth is that we are concerned by its conversion of EBIT to free cash flow. Looking at all the aforementioned factors together, it strikes us that artience can handle its debt fairly comfortably. Of course, while this leverage can enhance returns on equity, it does bring more risk, so it's worth keeping an eye on this one. Above most other metrics, we think its important to track how fast earnings per share is growing, if at all. If you've also come to that realization, you're in luck, because today you can view this interactive graph of artience's earnings per share history for free.
If, after all that, you're more interested in a fast growing company with a rock-solid balance sheet, then check out our list of net cash growth stocks without delay.
New: AI Stock Screener & Alerts
Our new AI Stock Screener scans the market every day to uncover opportunities.
• Dividend Powerhouses (3%+ Yield)
• Undervalued Small Caps with Insider Buying
• High growth Tech and AI Companies
Or build your own from over 50 metrics.
Have feedback on this article? Concerned about the content? Get in touch with us directly. Alternatively, email editorial-team (at) simplywallst.com.
This article by Simply Wall St is general in nature. We provide commentary based on historical data and analyst forecasts only using an unbiased methodology and our articles are not intended to be financial advice. It does not constitute a recommendation to buy or sell any stock, and does not take account of your objectives, or your financial situation. We aim to bring you long-term focused analysis driven by fundamental data. Note that our analysis may not factor in the latest price-sensitive company announcements or qualitative material. Simply Wall St has no position in any stocks mentioned.
About TSE:4634
artience
Engages in the colorants and functional materials, polymers and coatings, printing and information, and packaging materials businesses in Japan, Europe, Asia, the Americas, and internationally.
Flawless balance sheet, undervalued and pays a dividend.
Similar Companies
Market Insights

Advertisement
Community Narratives
MINISO's fair value is projected at 26.69 with an anticipated PE ratio shift of 20x
Fair Value US$24.03|11.0% undervalued
BE
Community Contributor
Procter & Gamble: A Dividend Giant Facing Slowing Growth
Fair Value US$119.81|23.3% overvalued
AN
Community Contributor
Eli Lilly's Future Growth Driven by Tirzepatide and Favorable Market Conditions
Fair Value US$1.19k|13.8% undervalued
EA
Community Contributor