Zeon (TSE:4205) shares have seen subtle movement this week, drawing attention from investors looking for clues on the company’s direction. With steady results over the month, some are watching for hints of shifting sentiment.
Zeon's recent share price gains have caught some attention, but it is the bigger picture that really stands out. While shares are up a modest 12% year to date, total shareholder return over the past year has reached over 30%, suggesting momentum is building and highlighting a solid recovery narrative.
With shares trending upward and returns accelerating, the key question becomes whether Zeon is still trading below its true value or if the optimism has already been fully priced in by the market. Could there still be room to buy?
Advertisement
Price-to-Earnings of 12.5x: Is it justified?
Zeon's shares are trading on a price-to-earnings (PE) ratio of 12.5x, which sits below both the Japanese Chemicals industry average and the wider market. At a closing price of ¥1,653, this suggests investors may not be fully pricing in the company’s underlying potential versus its sector peers.
The price-to-earnings ratio shows what investors are willing to pay for each yen of Zeon’s current earnings. In mature industries like chemicals, the PE ratio gives a valuable benchmark for how expectations stack up for the stock’s future profitability and growth trajectory.
With a PE ratio of 12.5x versus the Chemicals industry average of 12.9x and its peer average of 20.1x, Zeon looks attractively valued on this popular metric. In fact, its PE ratio is also slightly below the estimated fair PE (13.2x), which may indicate the market could be undervaluing its profit outlook. If valuation levels shift closer to the fair ratio, there could be room for price appreciation.
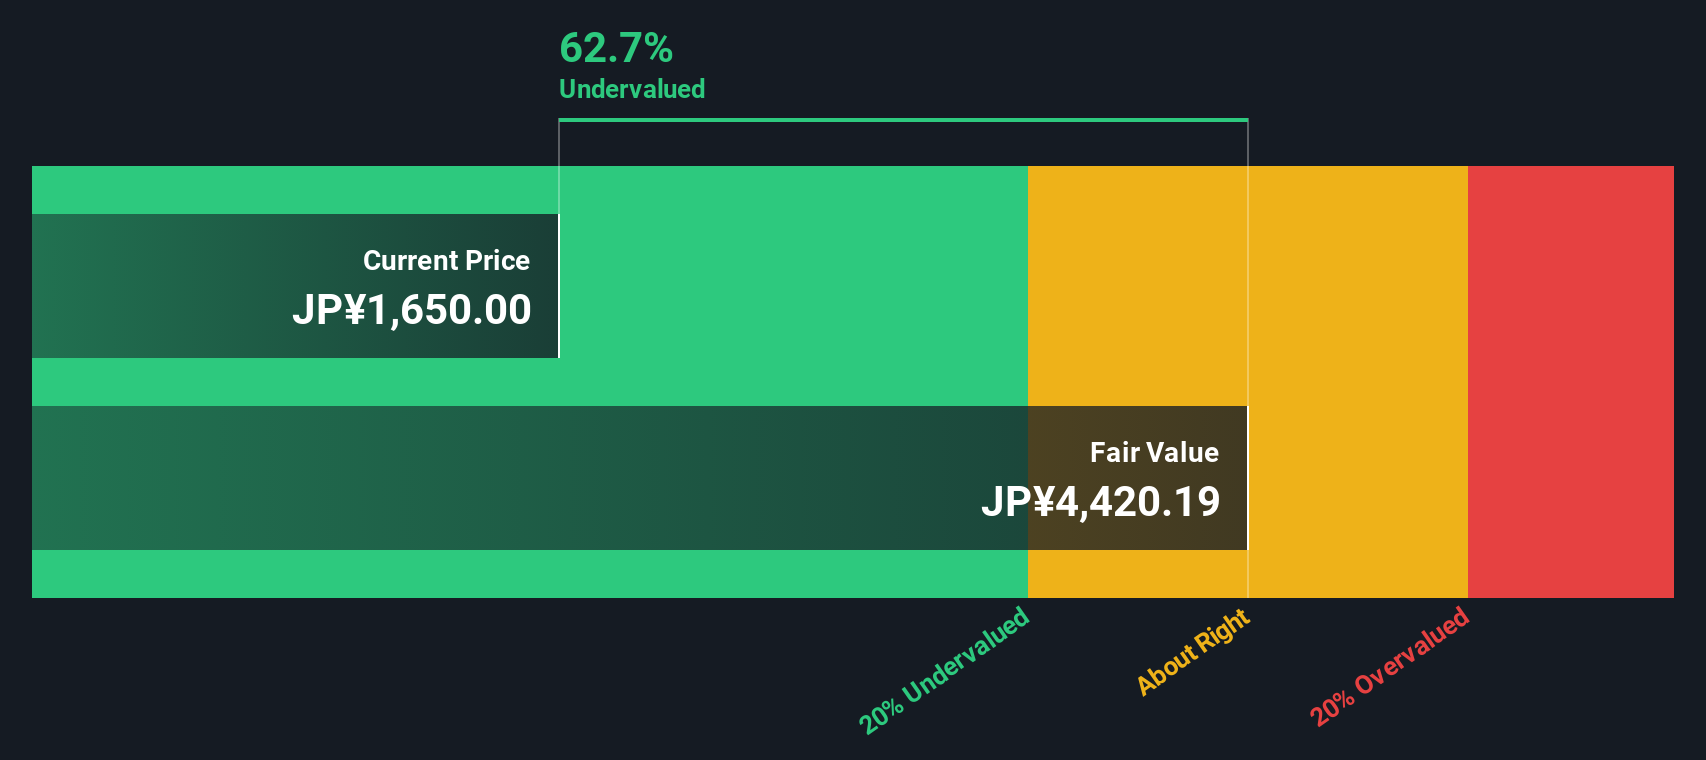
While Zeon's shares appear undervalued based on earnings ratios, the SWS DCF model shows an even more significant difference. At ¥1,653, Zeon trades 62.8% below our estimate of fair value (¥4,437.69). Could the market be overlooking something deeper about Zeon's financial future?
Simply Wall St performs a discounted cash flow (DCF) on every stock in the world every day (check out Zeon for example). We show the entire calculation in full. You can track the result in your watchlist or portfolio and be alerted when this changes, or use our stock screener to discover undervalued stocks based on their cash flows. If you save a screener we even alert you when new companies match - so you never miss a potential opportunity.
Build Your Own Zeon Narrative
If you want to dig into the numbers and form your own perspective, it's easy to build a personal investment case in just a few minutes. Simply Do it your way.
Don’t miss out on other powerful investment opportunities right now. Widen your options and give your portfolio an edge using these handpicked strategies:
Position yourself at the heart of innovation by capitalizing on these 24 AI penny stocks as AI transforms industries and unlocks new business growth.
This article by Simply Wall St is general in nature. We provide commentary based on historical data
and analyst forecasts only using an unbiased methodology and our articles are not intended to be financial advice. It does not constitute a recommendation to buy or sell any stock, and does not take account of your objectives, or your
financial situation. We aim to bring you long-term focused analysis driven by fundamental data.
Note that our analysis may not factor in the latest price-sensitive company announcements or qualitative material.
Simply Wall St has no position in any stocks mentioned.
Valuation is complex, but we're here to simplify it.
Discover if Zeon might be undervalued or overvalued with our detailed analysis, featuring fair value estimates, potential risks, dividends, insider trades, and its financial condition.