Advertisement
What Does the Recent Earnings Dip Mean for Zeon’s 2025 Valuation?

Simply Wall St
Reviewed by Bailey Pemberton
If you are thinking about what to do with Zeon stock right now, you are far from alone. Zeon has recently been grabbing attention with its steady performance, despite a few short-term bumps. Over the last week, the price dipped by 1.5%, and it has slipped 4.9% in the past month. But step back, and the broader picture tells a more interesting story: the stock is still up 11.2% year-to-date, and over the last five years, it has delivered an impressive return of 59.2%.
This combination of modest short-term volatility and powerful long-term growth hints at a company that the market is gradually reappraising. Investors seem to be weighing new developments in Zeon's industry as shifting global demand and evolving supply chain dynamics create opportunities and risks. Even with these cross-currents, most valuation screens are lighting up green for Zeon. In fact, it passes five out of the six key undervaluation checks, giving it a value score of 5.
So how do different valuation methods stack up, and what might they be missing? Let us explore the traditional ways to judge Zeon's worth before revealing a smarter, more holistic perspective at the end of this article.
Approach 1: Zeon Discounted Cash Flow (DCF) Analysis
A Discounted Cash Flow (DCF) model estimates a company’s intrinsic value by projecting its future cash flows and discounting them back to today’s value. This approach essentially asks, if you owned all of Zeon and received its future cash flows, what would those be worth in today’s yen, accounting for time and risk?
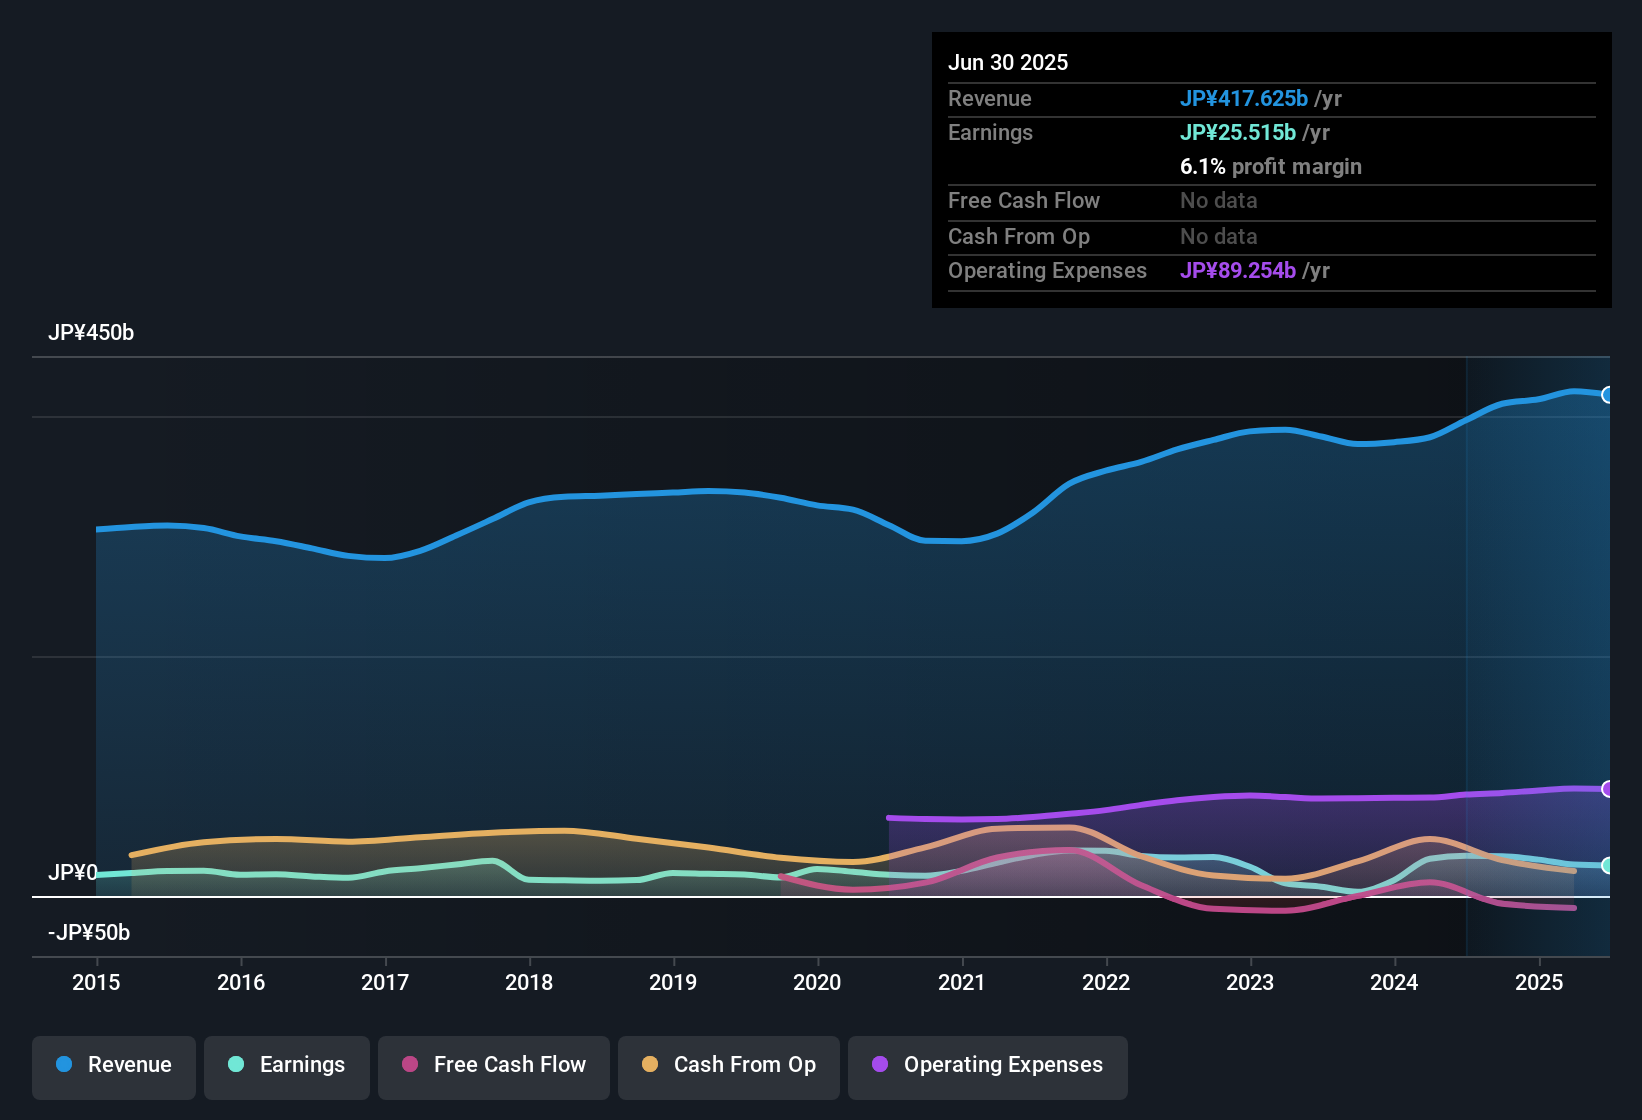
Zeon’s latest reported Free Cash Flow (FCF) is negative, at -¥12.0 billion, reflecting some recent operational or investment headwinds. However, analysts anticipate an inflection point; projections move sharply positive, with FCF expected to reach ¥14.6 billion in 2029 and ramp up to ¥31.1 billion in 2030. These estimates are based on a blend of analyst forecasts for the next five years and longer-term projections extrapolated by Simply Wall St for subsequent periods. Over the coming decade, FCF is expected to expand each year, ultimately exceeding ¥54.1 billion by 2035.
Applying this DCF approach, Zeon’s estimated intrinsic value stands at ¥4,417.63 per share. This calculation implies a substantial intrinsic discount, suggesting the stock is trading about 62.9% below its fair value. According to this method, Zeon appears significantly undervalued compared to its future earning power and growth prospects.
Result: UNDERVALUED
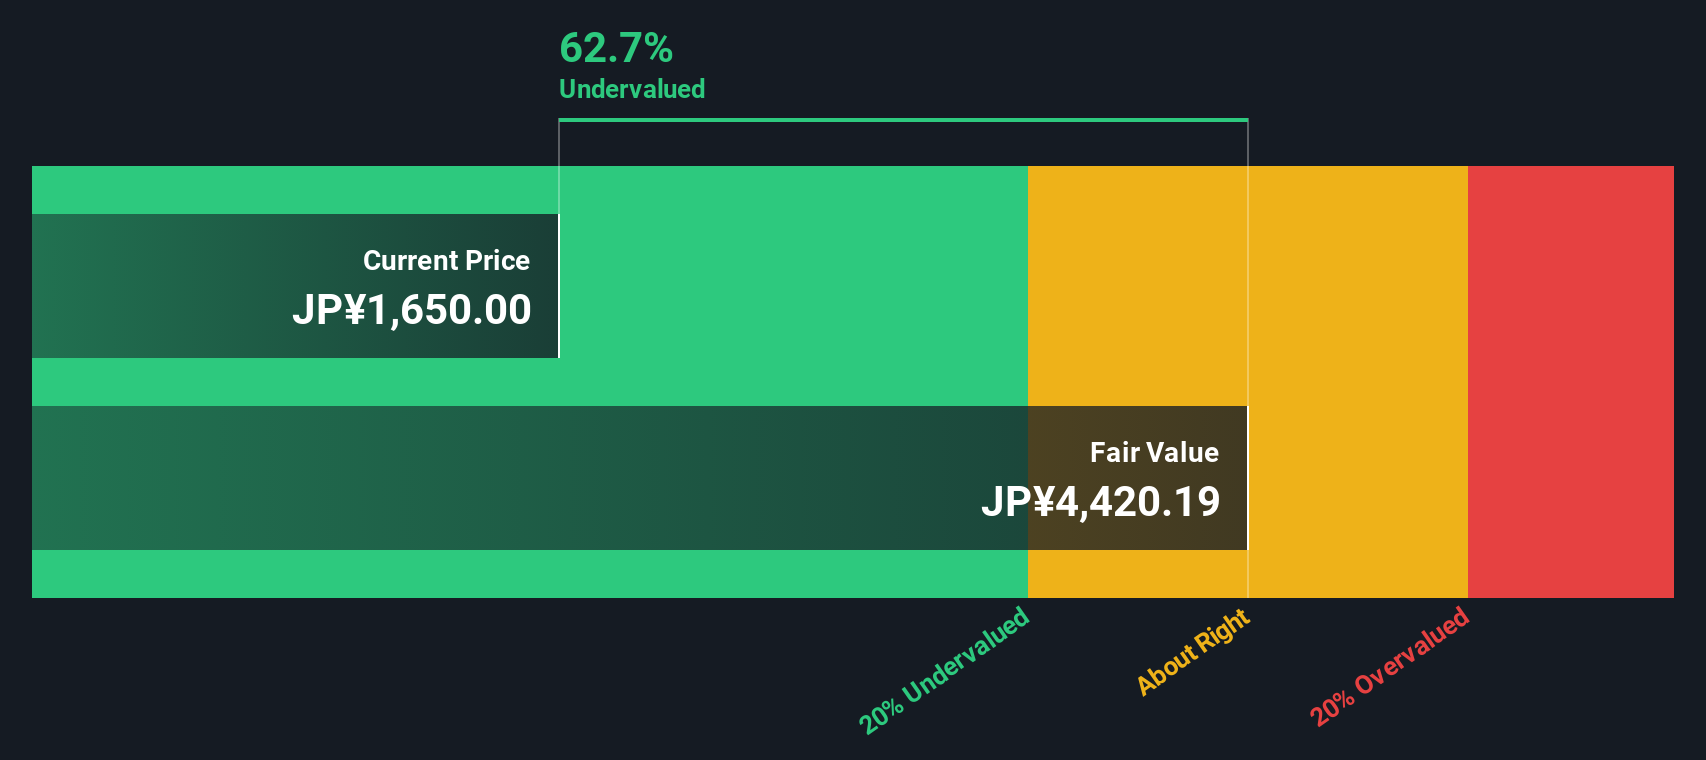
Our Discounted Cash Flow (DCF) analysis suggests Zeon is undervalued by 62.9%. Track this in your watchlist or portfolio, or discover more undervalued stocks.
Approach 2: Zeon Price vs Earnings (PE Ratio)
For companies with consistent earnings, the Price-to-Earnings (PE) ratio is often the preferred way to assess value. It provides a quick look at how much investors are willing to pay for each yen of current earnings, helping to gauge whether a stock is cheap or expensive relative to its profitability.
What constitutes a “normal” or “fair” PE ratio depends on growth outlook and risk. Higher expected earnings growth or lower risk typically justifies a higher PE. Lower growth or greater risk leads to a lower multiple. This means investors should be cautious about relying solely on comparisons to industry averages or peers, which may not fully reflect unique company factors.
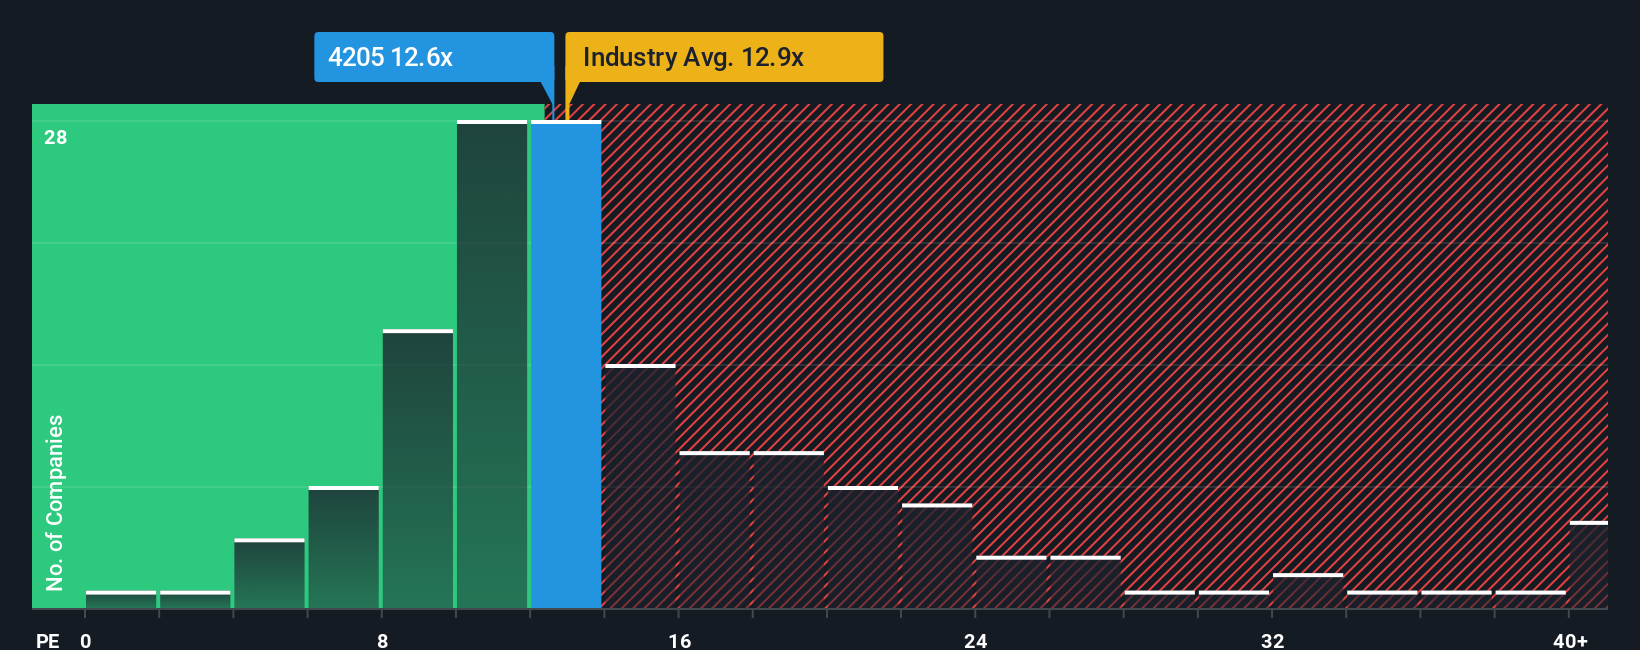
Currently, Zeon trades on a PE ratio of 12.5x. This lines up closely with the broader chemicals industry average of 12.6x, but is noticeably below the peer group average of 20.3x. Instead of just comparing these figures, Simply Wall St calculates a proprietary “Fair Ratio” for Zeon of 13.2x, which incorporates the company’s specific growth prospects, risk profile, profit margins, market cap, and its position within the industry.
The Fair Ratio represents what investors should expect to pay given Zeon’s unique outlook, rather than just how it stacks up against competitors. By taking a broader range of relevant factors into account, this approach provides a more balanced view of valuation.
With Zeon’s actual PE of 12.5x coming in very close to its Fair Ratio of 13.2x, the stock appears to be valued about right according to this metric.
Result: ABOUT RIGHT
PE ratios tell one story, but what if the real opportunity lies elsewhere? Discover companies where insiders are betting big on explosive growth.
Upgrade Your Decision Making: Choose your Zeon Narrative
Earlier we mentioned that there is an even better way to understand valuation, so let us introduce you to Narratives. A Narrative is your story and perspective about a company, combining numbers and assumptions into a personalized forecast and fair value estimation. Instead of just relying on a single model or ratio, Narratives let you connect your view of Zeon, whether it is based on expected revenue, profit margins, or industry changes, to a dynamic financial outlook.
Narratives are an intuitive and accessible tool on Simply Wall St’s Community page, used by millions of investors to cut through uncertainty. By linking Zeon’s ongoing story to investment decisions, Narratives automatically update as new news or earnings reports arrive. This reveals whether the company’s fair value has shifted above or below today’s share price.
This helps you decide when to buy or sell, informed by a transparent, evolving framework tailored to your investing style. For example, some investors expect Zeon’s fair value to increase based on aggressive growth forecasts, while others take a more cautious view and reflect lower price targets based on slower anticipated recovery. Narratives help ensure your investment choices reflect both the numbers and your personal outlook, all in one place.
Do you think there's more to the story for Zeon? Create your own Narrative to let the Community know!
This article by Simply Wall St is general in nature. We provide commentary based on historical data and analyst forecasts only using an unbiased methodology and our articles are not intended to be financial advice. It does not constitute a recommendation to buy or sell any stock, and does not take account of your objectives, or your financial situation. We aim to bring you long-term focused analysis driven by fundamental data. Note that our analysis may not factor in the latest price-sensitive company announcements or qualitative material. Simply Wall St has no position in any stocks mentioned.
Valuation is complex, but we're here to simplify it.
Discover if Zeon might be undervalued or overvalued with our detailed analysis, featuring fair value estimates, potential risks, dividends, insider trades, and its financial condition.
Access Free AnalysisHave feedback on this article? Concerned about the content? Get in touch with us directly. Alternatively, email editorial-team@simplywallst.com
About TSE:4205
Zeon
Engages in the elastomer materials, specialty materials, and other businesses in Japan, North America, Europe, and Asia.
Flawless balance sheet, undervalued and pays a dividend.
Similar Companies
Market Insights

Advertisement
Community Narratives
The Next Phase of Energy Storage: How NeoVolta Is Tackling America’s Power Crunch
Fair Value US$7.50|35.1% undervalued
MA
Community Contributor
Why EnSilica is Worth Possibly 13x its Current Price
Fair Value UK£5.00|89.8% undervalued
DO
Community Contributor
M&A Activity, Industry Diversification & A Defense Contract Monopoly Will Push BWXT For Healthy Long-Term Growth
Fair Value US$220.00|15.2% undervalued
CL
Community Contributor
A case for Cassiar Gold Corp (TSXV: GLDC) to reach CAD$8-10 before 2030 (X30-37)
Fair Value CA$10.00|96.0% undervalued
AG
Community Contributor