
Advertisement
- Japan
- /
- Medical Equipment
- /
- TSE:7730
Why Mani's (TSE:7730) Shaky Earnings Are Just The Beginning Of Its Problems
Last week's earnings announcement from Mani, Inc. (TSE:7730) was disappointing to investors, with a sluggish profit figure. Our analysis has found some reasons to be concerned, beyond the weak headline numbers.
We've discovered 2 warning signs about Mani. View them for free.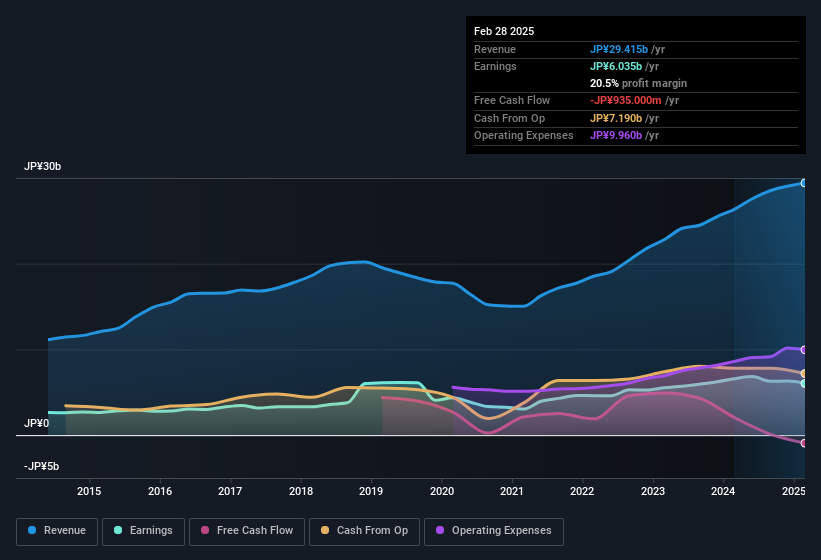
Examining Cashflow Against Mani's Earnings
Many investors haven't heard of the accrual ratio from cashflow, but it is actually a useful measure of how well a company's profit is backed up by free cash flow (FCF) during a given period. To get the accrual ratio we first subtract FCF from profit for a period, and then divide that number by the average operating assets for the period. You could think of the accrual ratio from cashflow as the 'non-FCF profit ratio'.
That means a negative accrual ratio is a good thing, because it shows that the company is bringing in more free cash flow than its profit would suggest. While it's not a problem to have a positive accrual ratio, indicating a certain level of non-cash profits, a high accrual ratio is arguably a bad thing, because it indicates paper profits are not matched by cash flow. That's because some academic studies have suggested that high accruals ratios tend to lead to lower profit or less profit growth.
For the year to February 2025, Mani had an accrual ratio of 0.22. We can therefore deduce that its free cash flow fell well short of covering its statutory profit. Over the last year it actually had negative free cash flow of JP¥935m, in contrast to the aforementioned profit of JP¥6.04b. We saw that FCF was JP¥2.1b a year ago though, so Mani has at least been able to generate positive FCF in the past.
That might leave you wondering what analysts are forecasting in terms of future profitability. Luckily, you can click here to see an interactive graph depicting future profitability, based on their estimates.
Our Take On Mani's Profit Performance
Mani didn't convert much of its profit to free cash flow in the last year, which some investors may consider rather suboptimal. Therefore, it seems possible to us that Mani's true underlying earnings power is actually less than its statutory profit. But at least holders can take some solace from the 31% per annum growth in EPS for the last three. The goal of this article has been to assess how well we can rely on the statutory earnings to reflect the company's potential, but there is plenty more to consider. In light of this, if you'd like to do more analysis on the company, it's vital to be informed of the risks involved. Case in point: We've spotted 2 warning signs for Mani you should be mindful of and 1 of these bad boys can't be ignored.
Today we've zoomed in on a single data point to better understand the nature of Mani's profit. But there is always more to discover if you are capable of focussing your mind on minutiae. Some people consider a high return on equity to be a good sign of a quality business. So you may wish to see this free collection of companies boasting high return on equity, or this list of stocks with high insider ownership.
New: Manage All Your Stock Portfolios in One Place
We've created the ultimate portfolio companion for stock investors, and it's free.
• Connect an unlimited number of Portfolios and see your total in one currency
• Be alerted to new Warning Signs or Risks via email or mobile
• Track the Fair Value of your stocks
Have feedback on this article? Concerned about the content? Get in touch with us directly. Alternatively, email editorial-team (at) simplywallst.com.
This article by Simply Wall St is general in nature. We provide commentary based on historical data and analyst forecasts only using an unbiased methodology and our articles are not intended to be financial advice. It does not constitute a recommendation to buy or sell any stock, and does not take account of your objectives, or your financial situation. We aim to bring you long-term focused analysis driven by fundamental data. Note that our analysis may not factor in the latest price-sensitive company announcements or qualitative material. Simply Wall St has no position in any stocks mentioned.
About TSE:7730
Mani
Engages in the manufacture and distribution of medical devices and dental instruments in Japan and internationally.
Flawless balance sheet with moderate growth potential.
Market Insights


Advertisement
Community Narratives
The Future of Drug Testing? Fingerprint Tech Shows Serious Promise
Fair Value US$2.98|40.3% undervalued
JO
Community Contributor
Suncorp’s Next Chapter: Insurance-Only and Ready to Grow
Fair Value AU$22.83|7.9% undervalued
RO
Community Contributor
Thyssenkrupp Nucera Will Achieve Double-Digit Profits by 2030 Boosted by Hydrogen Growth
Fair Value €14.40|31.6% undervalued
CH
Community Contributor
Tesla’s Nvidia Moment – The AI & Robotics Inflection Point
Fair Value US$359.72|12.3% undervalued
BL
Community Contributor