Advertisement
- Japan
- /
- Healthcare Services
- /
- TSE:7071
Amvis Holdings (TSE:7071) Margin Miss Challenges Bullish Growth Narrative

Simply Wall St
Reviewed by Simply Wall St
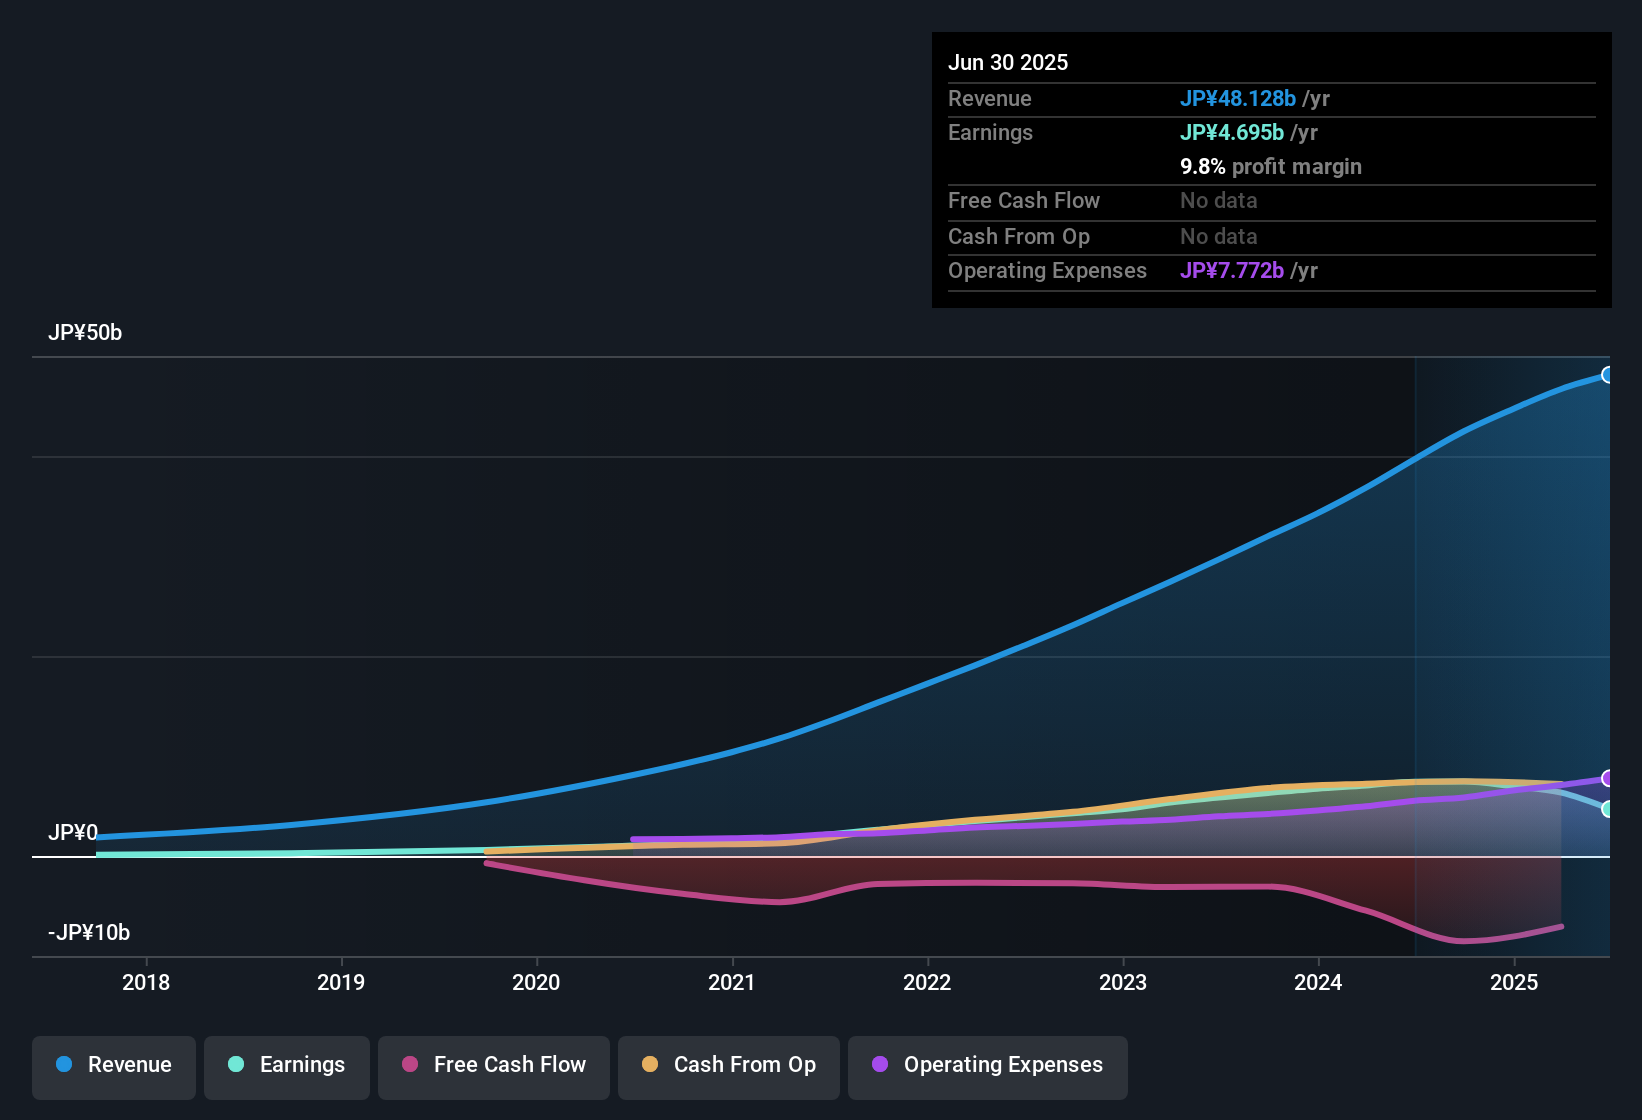
Amvis Holdings (TSE:7071) posted a net profit margin of 13.6%, slipping from last year’s 19.1%, with profit coming under pressure despite five-year average annual earnings growth of 33.4%. Analysts now forecast that earnings will rise at 15.5% annually and revenue at an even quicker 18.3% per year, beating the broader JP market’s 4.4% revenue growth projection. Investors will likely weigh this healthy longer-term growth outlook and the company’s discounted 9.2x Price-To-Earnings ratio, which sits below peers and the JP Healthcare industry, against recent margin compression and the setback in annual profit growth.
See our full analysis for Amvis Holdings.Next up, we’ll see how these earnings results square with the market narrative, highlighting where expectations align and where new questions emerge.
Curious how numbers become stories that shape markets? Explore Community Narratives
Profit Margins Dip Below Prior Years
- Net profit margin contracted to 13.6% from 19.1% last year, signaling a meaningful squeeze in profitability that diverges from the company’s five-year average annual earnings growth of 33.4%.
- Margin pressure weighs more heavily than expected when considering forecasts for 15.5% annual earnings growth. The prevailing market view emphasizes stable sector sentiment but notes the risk of operational cost pressures and regulatory scrutiny.
- The sizeable drop in margin, despite strong multi-year growth rates, highlights the tension between Amvis’s robust track record and recent headwinds.
- Investors are closely watching whether the company’s sector resilience and projected growth can sustain sentiment if margins do not rebound.
Non-Cash Earnings Raise Quality Questions
- The presence of a high level of non-cash earnings stands out as a red flag alongside the decline in profit margins, complicating assessments of ongoing earnings quality despite otherwise strong top-line trends.
- The prevailing market view points out that the blended effect of sector tailwinds and company fundamentals may support steady performance. Critics highlight that a heavier reliance on non-cash earnings can make reported profits less representative of actual cash generation.
- High non-cash earning levels, coupled with negative earnings growth over the past year, shape market caution even amid positive revenue projections.
- The absence of upbeat news or viral sentiment suggests investors are waiting for more clarity on true earnings durability.
Valuation Discount Versus Sector Peers
- Amvis trades at a 9.2x Price-To-Earnings ratio, a marked discount to both peer (15.9x) and JP Healthcare industry (14.4x) averages. This could appeal to value-focused investors while raising questions about future multiples if growth delivers as projected.
- According to the prevailing market view, the stock’s lower valuation multiple reflects steady rather than explosive growth expectations. If forecast-beating results materialize, sector optimism could drive a re-rating closer to the industry average.
- Rapidly forecasted revenue growth of 18.3% per year adds a layer of intrigue to the valuation gap, pressuring the market to re-assess Amvis’s pricing if execution matches projections.
- The ongoing discount provides both potential upside and a margin of safety in case sector conditions deteriorate.
Next Steps
Don't just look at this quarter; the real story is in the long-term trend. We've done an in-depth analysis on Amvis Holdings's growth and its valuation to see if today's price is a bargain. Add the company to your watchlist or portfolio now so you don't miss the next big move.
See What Else Is Out There
Amvis’s shrinking profit margins and growing reliance on non-cash earnings raise concerns about the true sustainability of its growth story.
If you want to focus on companies delivering consistent results, check out stable growth stocks screener (2084 results) for a list of businesses with steady earnings and reliable revenue momentum.
This article by Simply Wall St is general in nature. We provide commentary based on historical data and analyst forecasts only using an unbiased methodology and our articles are not intended to be financial advice. It does not constitute a recommendation to buy or sell any stock, and does not take account of your objectives, or your financial situation. We aim to bring you long-term focused analysis driven by fundamental data. Note that our analysis may not factor in the latest price-sensitive company announcements or qualitative material. Simply Wall St has no position in any stocks mentioned.
New: Manage All Your Stock Portfolios in One Place
We've created the ultimate portfolio companion for stock investors, and it's free.
• Connect an unlimited number of Portfolios and see your total in one currency
• Be alerted to new Warning Signs or Risks via email or mobile
• Track the Fair Value of your stocks
Have feedback on this article? Concerned about the content? Get in touch with us directly. Alternatively, email editorial-team@simplywallst.com
About TSE:7071
Adequate balance sheet and fair value.
Market Insights

Advertisement
Community Narratives
Kodiak AI - a potential 100 bagger opportunity?
Fair Value US$14.00|44.7% undervalued
DA
Community Contributor
A Fair Price for a Great Business Facing Real Threats
Fair Value US$383.06|13.0% undervalued
IM
Community Contributor
AXON And Shopify Integration Will Unlock Global Mobile Advertising
Fair Value US$646.30|0% overvalued
AN
Based on Analyst Price Targets