

Key Insights
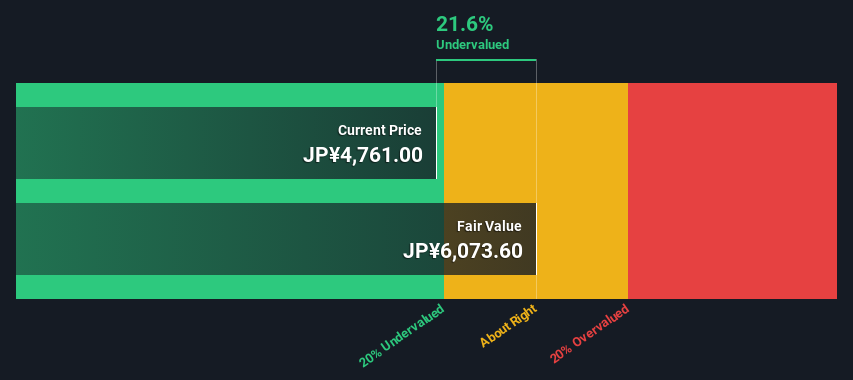
- Using the 2 Stage Free Cash Flow to Equity, Nihon Kohden fair value estimate is JP¥6,074
- Current share price of JP¥4,761 suggests Nihon Kohden is potentially 22% undervalued
- The JP¥4,480 analyst price target for 6849 is 26% less than our estimate of fair value
How far off is Nihon Kohden Corporation (TSE:6849) from its intrinsic value? Using the most recent financial data, we'll take a look at whether the stock is fairly priced by taking the expected future cash flows and discounting them to their present value. The Discounted Cash Flow (DCF) model is the tool we will apply to do this. Models like these may appear beyond the comprehension of a lay person, but they're fairly easy to follow.
Remember though, that there are many ways to estimate a company's value, and a DCF is just one method. If you want to learn more about discounted cash flow, the rationale behind this calculation can be read in detail in the Simply Wall St analysis model.
View our latest analysis for Nihon Kohden
The Calculation
We use what is known as a 2-stage model, which simply means we have two different periods of growth rates for the company's cash flows. Generally the first stage is higher growth, and the second stage is a lower growth phase. To start off with, we need to estimate the next ten years of cash flows. Where possible we use analyst estimates, but when these aren't available we extrapolate the previous free cash flow (FCF) from the last estimate or reported value. We assume companies with shrinking free cash flow will slow their rate of shrinkage, and that companies with growing free cash flow will see their growth rate slow, over this period. We do this to reflect that growth tends to slow more in the early years than it does in later years.
Generally we assume that a dollar today is more valuable than a dollar in the future, so we discount the value of these future cash flows to their estimated value in today's dollars:
10-year free cash flow (FCF) estimate
| 2024 | 2025 | 2026 | 2027 | 2028 | 2029 | 2030 | 2031 | 2032 | 2033 | |
| Levered FCF (¥, Millions) | JP¥9.72b | JP¥7.05b | JP¥9.81b | JP¥13.5b | JP¥15.1b | JP¥21.6b | JP¥25.3b | JP¥28.3b | JP¥30.8b | JP¥32.6b |
| Growth Rate Estimate Source | Analyst x4 | Analyst x2 | Analyst x5 | Analyst x5 | Analyst x4 | Analyst x2 | Est @ 17.26% | Est @ 12.14% | Est @ 8.56% | Est @ 6.05% |
| Present Value (¥, Millions) Discounted @ 5.4% | JP¥9.2k | JP¥6.3k | JP¥8.4k | JP¥10.9k | JP¥11.6k | JP¥15.7k | JP¥17.5k | JP¥18.6k | JP¥19.2k | JP¥19.3k |
("Est" = FCF growth rate estimated by Simply Wall St)
Present Value of 10-year Cash Flow (PVCF) = JP¥137b
We now need to calculate the Terminal Value, which accounts for all the future cash flows after this ten year period. For a number of reasons a very conservative growth rate is used that cannot exceed that of a country's GDP growth. In this case we have used the 5-year average of the 10-year government bond yield (0.2%) to estimate future growth. In the same way as with the 10-year 'growth' period, we discount future cash flows to today's value, using a cost of equity of 5.4%.
Terminal Value (TV)= FCF2033 × (1 + g) ÷ (r – g) = JP¥33b× (1 + 0.2%) ÷ (5.4%– 0.2%) = JP¥630b
Present Value of Terminal Value (PVTV)= TV / (1 + r)10= JP¥630b÷ ( 1 + 5.4%)10= JP¥373b
The total value, or equity value, is then the sum of the present value of the future cash flows, which in this case is JP¥510b. The last step is to then divide the equity value by the number of shares outstanding. Relative to the current share price of JP¥4.8k, the company appears a touch undervalued at a 22% discount to where the stock price trades currently. Valuations are imprecise instruments though, rather like a telescope - move a few degrees and end up in a different galaxy. Do keep this in mind.
Important Assumptions
The calculation above is very dependent on two assumptions. The first is the discount rate and the other is the cash flows. If you don't agree with these result, have a go at the calculation yourself and play with the assumptions. The DCF also does not consider the possible cyclicality of an industry, or a company's future capital requirements, so it does not give a full picture of a company's potential performance. Given that we are looking at Nihon Kohden as potential shareholders, the cost of equity is used as the discount rate, rather than the cost of capital (or weighted average cost of capital, WACC) which accounts for debt. In this calculation we've used 5.4%, which is based on a levered beta of 0.922. Beta is a measure of a stock's volatility, compared to the market as a whole. We get our beta from the industry average beta of globally comparable companies, with an imposed limit between 0.8 and 2.0, which is a reasonable range for a stable business.
SWOT Analysis for Nihon Kohden
- Debt is not viewed as a risk.
- Dividends are covered by earnings and cash flows.
- Earnings declined over the past year.
- Dividend is low compared to the top 25% of dividend payers in the Medical Equipment market.
- Annual revenue is forecast to grow faster than the Japanese market.
- Trading below our estimate of fair value by more than 20%.
- Annual earnings are forecast to grow slower than the Japanese market.
Next Steps:
Although the valuation of a company is important, it is only one of many factors that you need to assess for a company. It's not possible to obtain a foolproof valuation with a DCF model. Instead the best use for a DCF model is to test certain assumptions and theories to see if they would lead to the company being undervalued or overvalued. For instance, if the terminal value growth rate is adjusted slightly, it can dramatically alter the overall result. Why is the intrinsic value higher than the current share price? For Nihon Kohden, we've put together three further items you should explore:
- Financial Health: Does 6849 have a healthy balance sheet? Take a look at our free balance sheet analysis with six simple checks on key factors like leverage and risk.
- Future Earnings: How does 6849's growth rate compare to its peers and the wider market? Dig deeper into the analyst consensus number for the upcoming years by interacting with our free analyst growth expectation chart.
- Other High Quality Alternatives: Do you like a good all-rounder? Explore our interactive list of high quality stocks to get an idea of what else is out there you may be missing!
PS. The Simply Wall St app conducts a discounted cash flow valuation for every stock on the TSE every day. If you want to find the calculation for other stocks just search here.
If you're looking to trade Nihon Kohden, open an account with the lowest-cost platform trusted by professionals, Interactive Brokers.
With clients in over 200 countries and territories, and access to 160 markets, IBKR lets you trade stocks, options, futures, forex, bonds and funds from a single integrated account.
Enjoy no hidden fees, no account minimums, and FX conversion rates as low as 0.03%, far better than what most brokers offer.
Sponsored ContentValuation is complex, but we're here to simplify it.
Discover if Nihon Kohden might be undervalued or overvalued with our detailed analysis, featuring fair value estimates, potential risks, dividends, insider trades, and its financial condition.
Access Free AnalysisHave feedback on this article? Concerned about the content? Get in touch with us directly. Alternatively, email editorial-team (at) simplywallst.com.
This article by Simply Wall St is general in nature. We provide commentary based on historical data and analyst forecasts only using an unbiased methodology and our articles are not intended to be financial advice. It does not constitute a recommendation to buy or sell any stock, and does not take account of your objectives, or your financial situation. We aim to bring you long-term focused analysis driven by fundamental data. Note that our analysis may not factor in the latest price-sensitive company announcements or qualitative material. Simply Wall St has no position in any stocks mentioned.
About TSE:6849
Nihon Kohden
Engages in development, manufacturing, sale, maintenance, and consultation of medical electronic equipment, and related systems and products in Japan, Americas, Europe, rest of Asia, and internationally.
Solid track record with excellent balance sheet and pays a dividend.
Similar Companies
Market Insights

Community Narratives

