
Advertisement

Legendary fund manager Li Lu (who Charlie Munger backed) once said, 'The biggest investment risk is not the volatility of prices, but whether you will suffer a permanent loss of capital.' So it might be obvious that you need to consider debt, when you think about how risky any given stock is, because too much debt can sink a company. As with many other companies Medley, Inc. (TSE:4480) makes use of debt. But the more important question is: how much risk is that debt creating?
When Is Debt A Problem?
Generally speaking, debt only becomes a real problem when a company can't easily pay it off, either by raising capital or with its own cash flow. In the worst case scenario, a company can go bankrupt if it cannot pay its creditors. However, a more common (but still painful) scenario is that it has to raise new equity capital at a low price, thus permanently diluting shareholders. Of course, debt can be an important tool in businesses, particularly capital heavy businesses. The first thing to do when considering how much debt a business uses is to look at its cash and debt together.
View our latest analysis for Medley
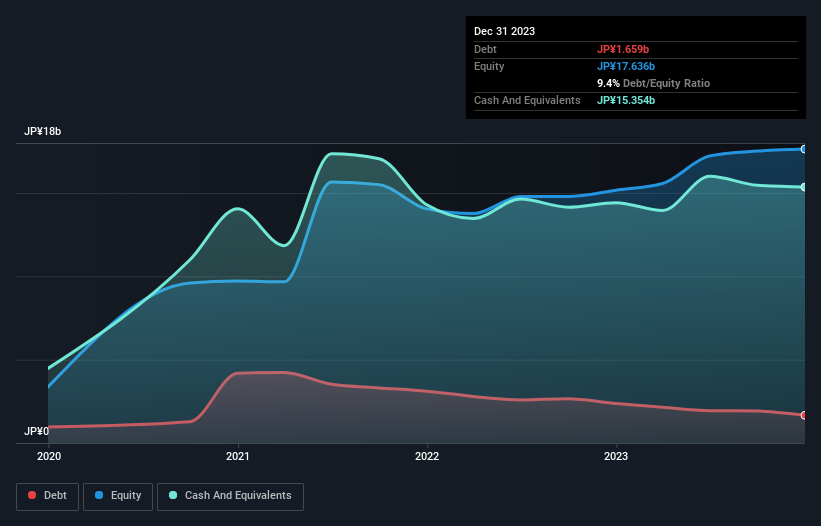
What Is Medley's Net Debt?
As you can see below, Medley had JP¥1.66b of debt at December 2023, down from JP¥2.38b a year prior. But it also has JP¥15.4b in cash to offset that, meaning it has JP¥13.7b net cash.
How Healthy Is Medley's Balance Sheet?
We can see from the most recent balance sheet that Medley had liabilities of JP¥6.23b falling due within a year, and liabilities of JP¥1.56b due beyond that. Offsetting this, it had JP¥15.4b in cash and JP¥2.95b in receivables that were due within 12 months. So it actually has JP¥10.5b more liquid assets than total liabilities.
This short term liquidity is a sign that Medley could probably pay off its debt with ease, as its balance sheet is far from stretched. Succinctly put, Medley boasts net cash, so it's fair to say it does not have a heavy debt load!
Better yet, Medley grew its EBIT by 106% last year, which is an impressive improvement. That boost will make it even easier to pay down debt going forward. When analysing debt levels, the balance sheet is the obvious place to start. But it is future earnings, more than anything, that will determine Medley's ability to maintain a healthy balance sheet going forward. So if you're focused on the future you can check out this free report showing analyst profit forecasts.
Finally, a company can only pay off debt with cold hard cash, not accounting profits. While Medley has net cash on its balance sheet, it's still worth taking a look at its ability to convert earnings before interest and tax (EBIT) to free cash flow, to help us understand how quickly it is building (or eroding) that cash balance. Happily for any shareholders, Medley actually produced more free cash flow than EBIT over the last three years. There's nothing better than incoming cash when it comes to staying in your lenders' good graces.
Summing Up
While we empathize with investors who find debt concerning, you should keep in mind that Medley has net cash of JP¥13.7b, as well as more liquid assets than liabilities. The cherry on top was that in converted 126% of that EBIT to free cash flow, bringing in JP¥3.5b. The bottom line is that we do not find Medley's debt levels at all concerning. Over time, share prices tend to follow earnings per share, so if you're interested in Medley, you may well want to click here to check an interactive graph of its earnings per share history.
Of course, if you're the type of investor who prefers buying stocks without the burden of debt, then don't hesitate to discover our exclusive list of net cash growth stocks, today.
New: Manage All Your Stock Portfolios in One Place
We've created the ultimate portfolio companion for stock investors, and it's free.
• Connect an unlimited number of Portfolios and see your total in one currency
• Be alerted to new Warning Signs or Risks via email or mobile
• Track the Fair Value of your stocks
Have feedback on this article? Concerned about the content? Get in touch with us directly. Alternatively, email editorial-team (at) simplywallst.com.
This article by Simply Wall St is general in nature. We provide commentary based on historical data and analyst forecasts only using an unbiased methodology and our articles are not intended to be financial advice. It does not constitute a recommendation to buy or sell any stock, and does not take account of your objectives, or your financial situation. We aim to bring you long-term focused analysis driven by fundamental data. Note that our analysis may not factor in the latest price-sensitive company announcements or qualitative material. Simply Wall St has no position in any stocks mentioned.
About TSE:4480
Medley
Operates platforms for recruitment and medical businesses in Japan and the United States.
High growth potential with adequate balance sheet.
Market Insights


Advertisement
Community Narratives
For the Emperor: Why Games Workshop Could Be a Star Investment
Fair Value UK£160.00|0.4% overvalued
RO
Community Contributor
Securitas will boost margins with AI and tech-driven services
Fair Value SEK 260.91|44.5% undervalued
UN
Community Contributor
A Leader in EV Charging with Growth Potential
Fair Value €27.00|17.8% undervalued
TI
Community Contributor