
Advertisement
- Japan
- /
- Healthtech
- /
- TSE:4320
CE Holdings Co.,Ltd. (TSE:4320) Stock Catapults 41% Though Its Price And Business Still Lag The Industry
CE Holdings Co.,Ltd. (TSE:4320) shares have continued their recent momentum with a 41% gain in the last month alone. The last month tops off a massive increase of 162% in the last year.
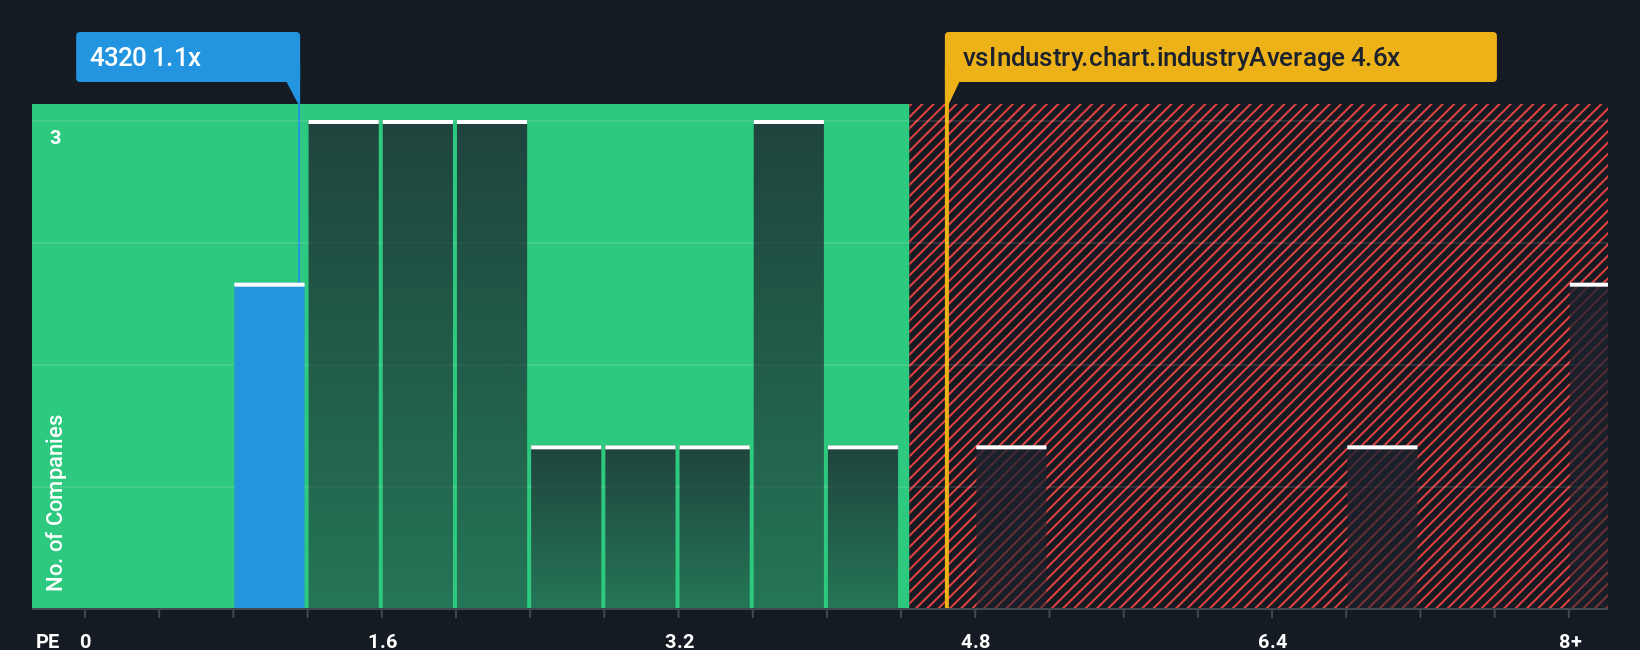
Although its price has surged higher, CE HoldingsLtd may still be sending buy signals at present with its price-to-sales (or "P/S") ratio of 1.1x, considering almost half of all companies in the Healthcare Services industry in Japan have P/S ratios greater than 2.7x and even P/S higher than 5x aren't out of the ordinary. Nonetheless, we'd need to dig a little deeper to determine if there is a rational basis for the reduced P/S.
View our latest analysis for CE HoldingsLtd
What Does CE HoldingsLtd's P/S Mean For Shareholders?
The revenue growth achieved at CE HoldingsLtd over the last year would be more than acceptable for most companies. It might be that many expect the respectable revenue performance to degrade substantially, which has repressed the P/S. Those who are bullish on CE HoldingsLtd will be hoping that this isn't the case, so that they can pick up the stock at a lower valuation.
Want the full picture on earnings, revenue and cash flow for the company? Then our free report on CE HoldingsLtd will help you shine a light on its historical performance.How Is CE HoldingsLtd's Revenue Growth Trending?
There's an inherent assumption that a company should underperform the industry for P/S ratios like CE HoldingsLtd's to be considered reasonable.
Retrospectively, the last year delivered a decent 7.8% gain to the company's revenues. Revenue has also lifted 15% in aggregate from three years ago, partly thanks to the last 12 months of growth. Therefore, it's fair to say the revenue growth recently has been respectable for the company.
Comparing that to the industry, which is predicted to deliver 19% growth in the next 12 months, the company's momentum is weaker, based on recent medium-term annualised revenue results.
With this in consideration, it's easy to understand why CE HoldingsLtd's P/S falls short of the mark set by its industry peers. It seems most investors are expecting to see the recent limited growth rates continue into the future and are only willing to pay a reduced amount for the stock.
The Key Takeaway
Despite CE HoldingsLtd's share price climbing recently, its P/S still lags most other companies. Typically, we'd caution against reading too much into price-to-sales ratios when settling on investment decisions, though it can reveal plenty about what other market participants think about the company.
In line with expectations, CE HoldingsLtd maintains its low P/S on the weakness of its recent three-year growth being lower than the wider industry forecast. At this stage investors feel the potential for an improvement in revenue isn't great enough to justify a higher P/S ratio. Unless the recent medium-term conditions improve, they will continue to form a barrier for the share price around these levels.
There are also other vital risk factors to consider before investing and we've discovered 1 warning sign for CE HoldingsLtd that you should be aware of.
Of course, profitable companies with a history of great earnings growth are generally safer bets. So you may wish to see this free collection of other companies that have reasonable P/E ratios and have grown earnings strongly.
New: AI Stock Screener & Alerts
Our new AI Stock Screener scans the market every day to uncover opportunities.
• Dividend Powerhouses (3%+ Yield)
• Undervalued Small Caps with Insider Buying
• High growth Tech and AI Companies
Or build your own from over 50 metrics.
Have feedback on this article? Concerned about the content? Get in touch with us directly. Alternatively, email editorial-team (at) simplywallst.com.
This article by Simply Wall St is general in nature. We provide commentary based on historical data and analyst forecasts only using an unbiased methodology and our articles are not intended to be financial advice. It does not constitute a recommendation to buy or sell any stock, and does not take account of your objectives, or your financial situation. We aim to bring you long-term focused analysis driven by fundamental data. Note that our analysis may not factor in the latest price-sensitive company announcements or qualitative material. Simply Wall St has no position in any stocks mentioned.
About TSE:4320
CE HoldingsLtd
Through its subsidiaries, develops and sells electronic medical record systems and medical information systems in Japan.
Flawless balance sheet established dividend payer.
Market Insights

Advertisement
Community Narratives
Finding The True Value Of A Logistics Powerhouse
Fair Value US$95.21|8.6% undervalued
NV
Community Contributor
Paradigm Biopharmaceuticals Will Lead Osteoarthritis Treatment with Zilosul's FDA Success
Fair Value AU$5.50|91.9% undervalued
AM
Community Contributor
Barrick Mining (ABX:CA): A Gold Hedge against a U.S. Shutdown
Fair Value CA$60.00|25.6% undervalued
GM
Community Contributor