

There are a few key trends to look for if we want to identify the next multi-bagger. Ideally, a business will show two trends; firstly a growing return on capital employed (ROCE) and secondly, an increasing amount of capital employed. Put simply, these types of businesses are compounding machines, meaning they are continually reinvesting their earnings at ever-higher rates of return. In light of that, when we looked at M3 (TSE:2413) and its ROCE trend, we weren't exactly thrilled.
What Is Return On Capital Employed (ROCE)?
If you haven't worked with ROCE before, it measures the 'return' (pre-tax profit) a company generates from capital employed in its business. To calculate this metric for M3, this is the formula:
Return on Capital Employed = Earnings Before Interest and Tax (EBIT) ÷ (Total Assets - Current Liabilities)
0.15 = JP¥63b ÷ (JP¥491b - JP¥67b) (Based on the trailing twelve months to March 2024).
So, M3 has an ROCE of 15%. That's a pretty standard return and it's in line with the industry average of 15%.
View our latest analysis for M3
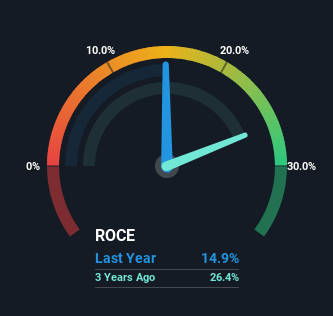
In the above chart we have measured M3's prior ROCE against its prior performance, but the future is arguably more important. If you'd like, you can check out the forecasts from the analysts covering M3 for free.
What Does the ROCE Trend For M3 Tell Us?
On the surface, the trend of ROCE at M3 doesn't inspire confidence. To be more specific, ROCE has fallen from 25% over the last five years. However it looks like M3 might be reinvesting for long term growth because while capital employed has increased, the company's sales haven't changed much in the last 12 months. It may take some time before the company starts to see any change in earnings from these investments.
The Bottom Line
To conclude, we've found that M3 is reinvesting in the business, but returns have been falling. And investors appear hesitant that the trends will pick up because the stock has fallen 23% in the last five years. On the whole, we aren't too inspired by the underlying trends and we think there may be better chances of finding a multi-bagger elsewhere.
While M3 doesn't shine too bright in this respect, it's still worth seeing if the company is trading at attractive prices. You can find that out with our FREE intrinsic value estimation for 2413 on our platform.
While M3 isn't earning the highest return, check out this free list of companies that are earning high returns on equity with solid balance sheets.
If you're looking to trade M3, open an account with the lowest-cost platform trusted by professionals, Interactive Brokers.
With clients in over 200 countries and territories, and access to 160 markets, IBKR lets you trade stocks, options, futures, forex, bonds and funds from a single integrated account.
Enjoy no hidden fees, no account minimums, and FX conversion rates as low as 0.03%, far better than what most brokers offer.
Sponsored ContentNew: Manage All Your Stock Portfolios in One Place
We've created the ultimate portfolio companion for stock investors, and it's free.
• Connect an unlimited number of Portfolios and see your total in one currency
• Be alerted to new Warning Signs or Risks via email or mobile
• Track the Fair Value of your stocks
Have feedback on this article? Concerned about the content? Get in touch with us directly. Alternatively, email editorial-team (at) simplywallst.com.
This article by Simply Wall St is general in nature. We provide commentary based on historical data and analyst forecasts only using an unbiased methodology and our articles are not intended to be financial advice. It does not constitute a recommendation to buy or sell any stock, and does not take account of your objectives, or your financial situation. We aim to bring you long-term focused analysis driven by fundamental data. Note that our analysis may not factor in the latest price-sensitive company announcements or qualitative material. Simply Wall St has no position in any stocks mentioned.
About TSE:2413
M3
Provides medical-related services primarily to physicians and other healthcare professionals through Internet.
Excellent balance sheet average dividend payer.
Market Insights

Community Narratives

