
Advertisement

Warren Buffett famously said, 'Volatility is far from synonymous with risk.' When we think about how risky a company is, we always like to look at its use of debt, since debt overload can lead to ruin. Importantly, M3, Inc. (TSE:2413) does carry debt. But should shareholders be worried about its use of debt?
When Is Debt A Problem?
Debt is a tool to help businesses grow, but if a business is incapable of paying off its lenders, then it exists at their mercy. Ultimately, if the company can't fulfill its legal obligations to repay debt, shareholders could walk away with nothing. However, a more common (but still painful) scenario is that it has to raise new equity capital at a low price, thus permanently diluting shareholders. Having said that, the most common situation is where a company manages its debt reasonably well - and to its own advantage. The first step when considering a company's debt levels is to consider its cash and debt together.
What Is M3's Net Debt?
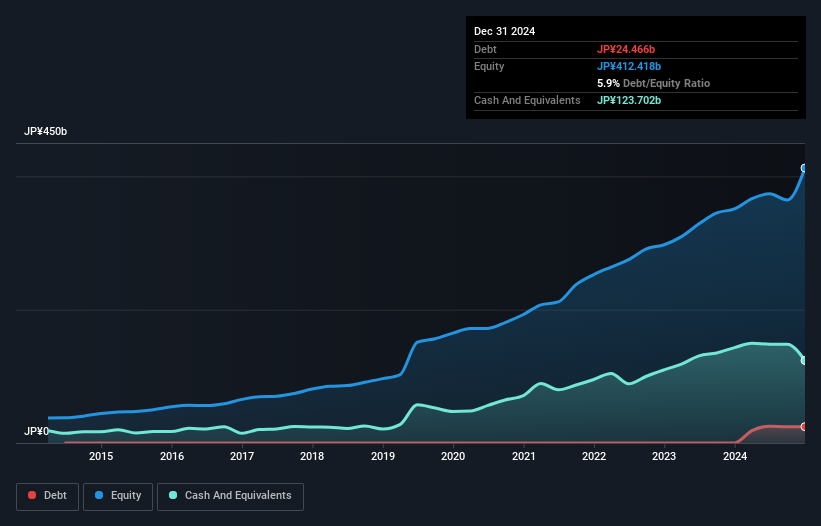
You can click the graphic below for the historical numbers, but it shows that as of December 2024 M3 had JP¥24.5b of debt, an increase on none, over one year. But it also has JP¥123.7b in cash to offset that, meaning it has JP¥99.2b net cash.
How Strong Is M3's Balance Sheet?
According to the last reported balance sheet, M3 had liabilities of JP¥80.3b due within 12 months, and liabilities of JP¥84.8b due beyond 12 months. Offsetting these obligations, it had cash of JP¥123.7b as well as receivables valued at JP¥67.8b due within 12 months. So it actually has JP¥26.4b more liquid assets than total liabilities.
This short term liquidity is a sign that M3 could probably pay off its debt with ease, as its balance sheet is far from stretched. Succinctly put, M3 boasts net cash, so it's fair to say it does not have a heavy debt load!
See our latest analysis for M3
But the bad news is that M3 has seen its EBIT plunge 11% in the last twelve months. If that rate of decline in earnings continues, the company could find itself in a tight spot. When analysing debt levels, the balance sheet is the obvious place to start. But it is future earnings, more than anything, that will determine M3's ability to maintain a healthy balance sheet going forward. So if you're focused on the future you can check out this free report showing analyst profit forecasts.
Finally, a company can only pay off debt with cold hard cash, not accounting profits. M3 may have net cash on the balance sheet, but it is still interesting to look at how well the business converts its earnings before interest and tax (EBIT) to free cash flow, because that will influence both its need for, and its capacity to manage debt. Over the most recent three years, M3 recorded free cash flow worth 74% of its EBIT, which is around normal, given free cash flow excludes interest and tax. This free cash flow puts the company in a good position to pay down debt, when appropriate.
Summing Up
While we empathize with investors who find debt concerning, you should keep in mind that M3 has net cash of JP¥99.2b, as well as more liquid assets than liabilities. And it impressed us with free cash flow of JP¥49b, being 74% of its EBIT. So is M3's debt a risk? It doesn't seem so to us. There's no doubt that we learn most about debt from the balance sheet. But ultimately, every company can contain risks that exist outside of the balance sheet. For example, we've discovered 1 warning sign for M3 that you should be aware of before investing here.
If you're interested in investing in businesses that can grow profits without the burden of debt, then check out this free list of growing businesses that have net cash on the balance sheet.
New: Manage All Your Stock Portfolios in One Place
We've created the ultimate portfolio companion for stock investors, and it's free.
• Connect an unlimited number of Portfolios and see your total in one currency
• Be alerted to new Warning Signs or Risks via email or mobile
• Track the Fair Value of your stocks
Have feedback on this article? Concerned about the content? Get in touch with us directly. Alternatively, email editorial-team (at) simplywallst.com.
This article by Simply Wall St is general in nature. We provide commentary based on historical data and analyst forecasts only using an unbiased methodology and our articles are not intended to be financial advice. It does not constitute a recommendation to buy or sell any stock, and does not take account of your objectives, or your financial situation. We aim to bring you long-term focused analysis driven by fundamental data. Note that our analysis may not factor in the latest price-sensitive company announcements or qualitative material. Simply Wall St has no position in any stocks mentioned.
About TSE:2413
M3
Provides medical-related services primarily to physicians and other healthcare professionals through Internet.
Excellent balance sheet average dividend payer.
Market Insights

Advertisement
Community Narratives
Groundbreaking therapies that could change the treatment landscape for PTSD, fibromyalgia, MS & Alzheimer’s
Fair Value US$6.20|86.9% undervalued
CM
Community Contributor
DigitalOcean Will Grow 14% by Embracing AI with Paperspace Acquisition
Fair Value US$50.00|42.8% undervalued
NE
Community Contributor
Viant Technology: A Rising AdTech Challenger in the AI-Powered CTV Market
Fair Value US$38.61|66.0% undervalued
BL
Community Contributor
Volvo will Accelerate Forward into Electric and Autonomous Leadership in Five Years
Fair Value SEK 438.80|40.8% undervalued
UN
Community Contributor