- Japan
- /
- Healthcare Services
- /
- SPSE:3055
Will Hokuyaku Takeyama HoldingsInc (SPSE:3055) Multiply In Value Going Forward?


What are the early trends we should look for to identify a stock that could multiply in value over the long term? Firstly, we'll want to see a proven return on capital employed (ROCE) that is increasing, and secondly, an expanding base of capital employed. Put simply, these types of businesses are compounding machines, meaning they are continually reinvesting their earnings at ever-higher rates of return. Although, when we looked at Hokuyaku Takeyama HoldingsInc (SPSE:3055), it didn't seem to tick all of these boxes.
Understanding Return On Capital Employed (ROCE)
For those that aren't sure what ROCE is, it measures the amount of pre-tax profits a company can generate from the capital employed in its business. The formula for this calculation on Hokuyaku Takeyama HoldingsInc is:
Return on Capital Employed = Earnings Before Interest and Tax (EBIT) ÷ (Total Assets - Current Liabilities)
0.04 = JP¥2.3b ÷ (JP¥138b - JP¥80b) (Based on the trailing twelve months to December 2020).
Thus, Hokuyaku Takeyama HoldingsInc has an ROCE of 4.0%. In absolute terms, that's a low return and it also under-performs the Healthcare industry average of 10%.
View our latest analysis for Hokuyaku Takeyama HoldingsInc
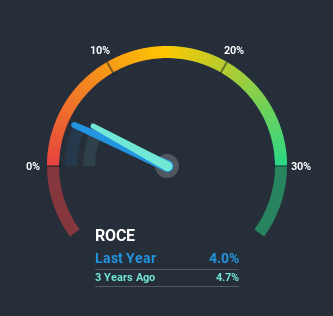
Historical performance is a great place to start when researching a stock so above you can see the gauge for Hokuyaku Takeyama HoldingsInc's ROCE against it's prior returns. If you want to delve into the historical earnings, revenue and cash flow of Hokuyaku Takeyama HoldingsInc, check out these free graphs here.
What Does the ROCE Trend For Hokuyaku Takeyama HoldingsInc Tell Us?
Things have been pretty stable at Hokuyaku Takeyama HoldingsInc, with its capital employed and returns on that capital staying somewhat the same for the last five years. Businesses with these traits tend to be mature and steady operations because they're past the growth phase. With that in mind, unless investment picks up again in the future, we wouldn't expect Hokuyaku Takeyama HoldingsInc to be a multi-bagger going forward.
On a separate but related note, it's important to know that Hokuyaku Takeyama HoldingsInc has a current liabilities to total assets ratio of 58%, which we'd consider pretty high. This effectively means that suppliers (or short-term creditors) are funding a large portion of the business, so just be aware that this can introduce some elements of risk. While it's not necessarily a bad thing, it can be beneficial if this ratio is lower.
In Conclusion...
We can conclude that in regards to Hokuyaku Takeyama HoldingsInc's returns on capital employed and the trends, there isn't much change to report on. And investors may be recognizing these trends since the stock has only returned a total of 31% to shareholders over the last five years. As a result, if you're hunting for a multi-bagger, we think you'd have more luck elsewhere.
If you want to continue researching Hokuyaku Takeyama HoldingsInc, you might be interested to know about the 1 warning sign that our analysis has discovered.
For those who like to invest in solid companies, check out this free list of companies with solid balance sheets and high returns on equity.
When trading Hokuyaku Takeyama HoldingsInc or any other investment, use the platform considered by many to be the Professional's Gateway to the Worlds Market, Interactive Brokers. You get the lowest-cost* trading on stocks, options, futures, forex, bonds and funds worldwide from a single integrated account. Promoted
Valuation is complex, but we're here to simplify it.
Discover if Hokuyaku Takeyama HoldingsInc might be undervalued or overvalued with our detailed analysis, featuring fair value estimates, potential risks, dividends, insider trades, and its financial condition.
Access Free AnalysisThis article by Simply Wall St is general in nature. It does not constitute a recommendation to buy or sell any stock, and does not take account of your objectives, or your financial situation. We aim to bring you long-term focused analysis driven by fundamental data. Note that our analysis may not factor in the latest price-sensitive company announcements or qualitative material. Simply Wall St has no position in any stocks mentioned.
*Interactive Brokers Rated Lowest Cost Broker by StockBrokers.com Annual Online Review 2020
Have feedback on this article? Concerned about the content? Get in touch with us directly. Alternatively, email editorial-team (at) simplywallst.com.
About SPSE:3055
Hokuyaku Takeyama HoldingsInc
Engages in the wholesale of pharmaceutical products in Japan.
Flawless balance sheet with solid track record and pays a dividend.
Market Insights

Community Narratives

