
Advertisement
There May Be Underlying Issues With The Quality Of Delica Foods HoldingsLtd's (TSE:3392) Earnings

Despite posting some strong earnings, the market for Delica Foods Holdings Co.,Ltd.'s (TSE:3392) stock hasn't moved much. Our analysis suggests that this might be because shareholders have noticed some concerning underlying factors.
See our latest analysis for Delica Foods HoldingsLtd
Examining Cashflow Against Delica Foods HoldingsLtd's Earnings
In high finance, the key ratio used to measure how well a company converts reported profits into free cash flow (FCF) is the accrual ratio (from cashflow). The accrual ratio subtracts the FCF from the profit for a given period, and divides the result by the average operating assets of the company over that time. This ratio tells us how much of a company's profit is not backed by free cashflow.
Therefore, it's actually considered a good thing when a company has a negative accrual ratio, but a bad thing if its accrual ratio is positive. While having an accrual ratio above zero is of little concern, we do think it's worth noting when a company has a relatively high accrual ratio. To quote a 2014 paper by Lewellen and Resutek, "firms with higher accruals tend to be less profitable in the future".
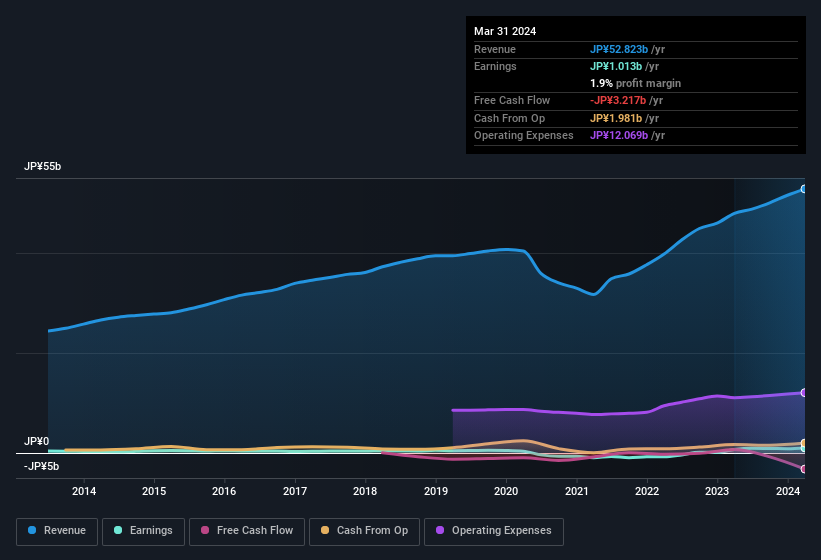
Over the twelve months to March 2024, Delica Foods HoldingsLtd recorded an accrual ratio of 0.27. We can therefore deduce that its free cash flow fell well short of covering its statutory profit. In the last twelve months it actually had negative free cash flow, with an outflow of JP¥3.2b despite its profit of JP¥1.01b, mentioned above. It's worth noting that Delica Foods HoldingsLtd generated positive FCF of JP¥707m a year ago, so at least they've done it in the past. One positive for Delica Foods HoldingsLtd shareholders is that it's accrual ratio was significantly better last year, providing reason to believe that it may return to stronger cash conversion in the future. As a result, some shareholders may be looking for stronger cash conversion in the current year.
That might leave you wondering what analysts are forecasting in terms of future profitability. Luckily, you can click here to see an interactive graph depicting future profitability, based on their estimates.
Our Take On Delica Foods HoldingsLtd's Profit Performance
Delica Foods HoldingsLtd's accrual ratio for the last twelve months signifies cash conversion is less than ideal, which is a negative when it comes to our view of its earnings. Therefore, it seems possible to us that Delica Foods HoldingsLtd's true underlying earnings power is actually less than its statutory profit. But at least holders can take some solace from the 32% EPS growth in the last year. The goal of this article has been to assess how well we can rely on the statutory earnings to reflect the company's potential, but there is plenty more to consider. So if you'd like to dive deeper into this stock, it's crucial to consider any risks it's facing. For instance, we've identified 5 warning signs for Delica Foods HoldingsLtd (3 are concerning) you should be familiar with.
This note has only looked at a single factor that sheds light on the nature of Delica Foods HoldingsLtd's profit. But there are plenty of other ways to inform your opinion of a company. For example, many people consider a high return on equity as an indication of favorable business economics, while others like to 'follow the money' and search out stocks that insiders are buying. While it might take a little research on your behalf, you may find this free collection of companies boasting high return on equity, or this list of stocks with significant insider holdings to be useful.
New: Manage All Your Stock Portfolios in One Place
We've created the ultimate portfolio companion for stock investors, and it's free.
• Connect an unlimited number of Portfolios and see your total in one currency
• Be alerted to new Warning Signs or Risks via email or mobile
• Track the Fair Value of your stocks
Have feedback on this article? Concerned about the content? Get in touch with us directly. Alternatively, email editorial-team (at) simplywallst.com.
This article by Simply Wall St is general in nature. We provide commentary based on historical data and analyst forecasts only using an unbiased methodology and our articles are not intended to be financial advice. It does not constitute a recommendation to buy or sell any stock, and does not take account of your objectives, or your financial situation. We aim to bring you long-term focused analysis driven by fundamental data. Note that our analysis may not factor in the latest price-sensitive company announcements or qualitative material. Simply Wall St has no position in any stocks mentioned.
About TSE:3392
Delica Foods Holdings
Engages in the distribution of agricultural products in Japan.
Reasonable growth potential with adequate balance sheet.
Market Insights

Advertisement
Community Narratives
Groundbreaking therapies that could change the treatment landscape for PTSD, fibromyalgia, MS & Alzheimer’s
Fair Value US$6.20|86.9% undervalued
CM
Community Contributor
DigitalOcean Will Grow 14% by Embracing AI with Paperspace Acquisition
Fair Value US$50.00|41.7% undervalued
NE
Community Contributor
Viant Technology: A Rising AdTech Challenger in the AI-Powered CTV Market
Fair Value US$38.61|63.2% undervalued
BL
Community Contributor
Volvo will Accelerate Forward into Electric and Autonomous Leadership in Five Years
Fair Value SEK 438.80|39.7% undervalued
UN
Community Contributor