Is Nissin Foods Holdings Co.,Ltd. (TSE:2897) Trading At A 26% Discount?


Key Insights
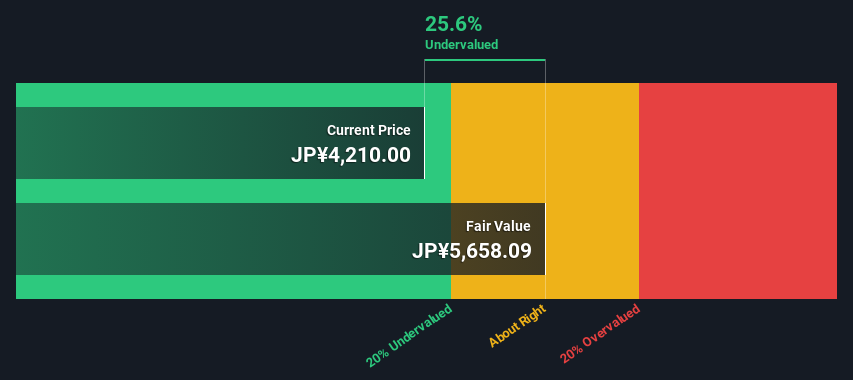
- The projected fair value for Nissin Foods HoldingsLtd is JP¥5,658 based on 2 Stage Free Cash Flow to Equity
- Nissin Foods HoldingsLtd's JP¥4,210 share price signals that it might be 26% undervalued
- Our fair value estimate is 1.9% higher than Nissin Foods HoldingsLtd's analyst price target of JP¥5,555
Today we will run through one way of estimating the intrinsic value of Nissin Foods Holdings Co.,Ltd. (TSE:2897) by taking the expected future cash flows and discounting them to today's value. We will use the Discounted Cash Flow (DCF) model on this occasion. Before you think you won't be able to understand it, just read on! It's actually much less complex than you'd imagine.
We would caution that there are many ways of valuing a company and, like the DCF, each technique has advantages and disadvantages in certain scenarios. For those who are keen learners of equity analysis, the Simply Wall St analysis model here may be something of interest to you.
Check out our latest analysis for Nissin Foods HoldingsLtd
Step By Step Through The Calculation
We're using the 2-stage growth model, which simply means we take in account two stages of company's growth. In the initial period the company may have a higher growth rate and the second stage is usually assumed to have a stable growth rate. In the first stage we need to estimate the cash flows to the business over the next ten years. Where possible we use analyst estimates, but when these aren't available we extrapolate the previous free cash flow (FCF) from the last estimate or reported value. We assume companies with shrinking free cash flow will slow their rate of shrinkage, and that companies with growing free cash flow will see their growth rate slow, over this period. We do this to reflect that growth tends to slow more in the early years than it does in later years.
A DCF is all about the idea that a dollar in the future is less valuable than a dollar today, so we discount the value of these future cash flows to their estimated value in today's dollars:
10-year free cash flow (FCF) forecast
| 2024 | 2025 | 2026 | 2027 | 2028 | 2029 | 2030 | 2031 | 2032 | 2033 | |
| Levered FCF (¥, Millions) | JP¥14.3b | JP¥43.3b | JP¥46.8b | JP¥45.7b | JP¥67.7b | JP¥74.5b | JP¥79.7b | JP¥83.7b | JP¥86.7b | JP¥88.9b |
| Growth Rate Estimate Source | Analyst x2 | Analyst x4 | Analyst x4 | Analyst x2 | Analyst x2 | Est @ 9.99% | Est @ 7.05% | Est @ 5.00% | Est @ 3.56% | Est @ 2.55% |
| Present Value (¥, Millions) Discounted @ 4.7% | JP¥13.6k | JP¥39.5k | JP¥40.8k | JP¥38.1k | JP¥53.8k | JP¥56.5k | JP¥57.8k | JP¥58.0k | JP¥57.3k | JP¥56.1k |
("Est" = FCF growth rate estimated by Simply Wall St)
Present Value of 10-year Cash Flow (PVCF) = JP¥471b
The second stage is also known as Terminal Value, this is the business's cash flow after the first stage. For a number of reasons a very conservative growth rate is used that cannot exceed that of a country's GDP growth. In this case we have used the 5-year average of the 10-year government bond yield (0.2%) to estimate future growth. In the same way as with the 10-year 'growth' period, we discount future cash flows to today's value, using a cost of equity of 4.7%.
Terminal Value (TV)= FCF2033 × (1 + g) ÷ (r – g) = JP¥89b× (1 + 0.2%) ÷ (4.7%– 0.2%) = JP¥2.0t
Present Value of Terminal Value (PVTV)= TV / (1 + r)10= JP¥2.0t÷ ( 1 + 4.7%)10= JP¥1.2t
The total value, or equity value, is then the sum of the present value of the future cash flows, which in this case is JP¥1.7t. In the final step we divide the equity value by the number of shares outstanding. Relative to the current share price of JP¥4.2k, the company appears a touch undervalued at a 26% discount to where the stock price trades currently. Valuations are imprecise instruments though, rather like a telescope - move a few degrees and end up in a different galaxy. Do keep this in mind.
The Assumptions
The calculation above is very dependent on two assumptions. The first is the discount rate and the other is the cash flows. If you don't agree with these result, have a go at the calculation yourself and play with the assumptions. The DCF also does not consider the possible cyclicality of an industry, or a company's future capital requirements, so it does not give a full picture of a company's potential performance. Given that we are looking at Nissin Foods HoldingsLtd as potential shareholders, the cost of equity is used as the discount rate, rather than the cost of capital (or weighted average cost of capital, WACC) which accounts for debt. In this calculation we've used 4.7%, which is based on a levered beta of 0.800. Beta is a measure of a stock's volatility, compared to the market as a whole. We get our beta from the industry average beta of globally comparable companies, with an imposed limit between 0.8 and 2.0, which is a reasonable range for a stable business.
SWOT Analysis for Nissin Foods HoldingsLtd
- Earnings growth over the past year exceeded the industry.
- Debt is not viewed as a risk.
- Dividends are covered by earnings and cash flows.
- Dividend is low compared to the top 25% of dividend payers in the Food market.
- Annual earnings are forecast to grow for the next 4 years.
- Trading below our estimate of fair value by more than 20%.
- Annual earnings are forecast to grow slower than the Japanese market.
Moving On:
Although the valuation of a company is important, it is only one of many factors that you need to assess for a company. DCF models are not the be-all and end-all of investment valuation. Preferably you'd apply different cases and assumptions and see how they would impact the company's valuation. For example, changes in the company's cost of equity or the risk free rate can significantly impact the valuation. What is the reason for the share price sitting below the intrinsic value? For Nissin Foods HoldingsLtd, we've compiled three essential aspects you should consider:
- Risks: We feel that you should assess the 1 warning sign for Nissin Foods HoldingsLtd we've flagged before making an investment in the company.
- Future Earnings: How does 2897's growth rate compare to its peers and the wider market? Dig deeper into the analyst consensus number for the upcoming years by interacting with our free analyst growth expectation chart.
- Other High Quality Alternatives: Do you like a good all-rounder? Explore our interactive list of high quality stocks to get an idea of what else is out there you may be missing!
PS. The Simply Wall St app conducts a discounted cash flow valuation for every stock on the TSE every day. If you want to find the calculation for other stocks just search here.
Valuation is complex, but we're here to simplify it.
Discover if Nissin Foods HoldingsLtd might be undervalued or overvalued with our detailed analysis, featuring fair value estimates, potential risks, dividends, insider trades, and its financial condition.
Access Free AnalysisHave feedback on this article? Concerned about the content? Get in touch with us directly. Alternatively, email editorial-team (at) simplywallst.com.
This article by Simply Wall St is general in nature. We provide commentary based on historical data and analyst forecasts only using an unbiased methodology and our articles are not intended to be financial advice. It does not constitute a recommendation to buy or sell any stock, and does not take account of your objectives, or your financial situation. We aim to bring you long-term focused analysis driven by fundamental data. Note that our analysis may not factor in the latest price-sensitive company announcements or qualitative material. Simply Wall St has no position in any stocks mentioned.
About TSE:2897
Nissin Foods HoldingsLtd
Engages in the manufacture and sale of instant foods in Japan and internationally.
Excellent balance sheet and fair value.
Market Insights

Community Narratives

