

Howard Marks put it nicely when he said that, rather than worrying about share price volatility, 'The possibility of permanent loss is the risk I worry about... and every practical investor I know worries about.' So it might be obvious that you need to consider debt, when you think about how risky any given stock is, because too much debt can sink a company. We note that Kewpie Corporation (TSE:2809) does have debt on its balance sheet. But is this debt a concern to shareholders?
What Risk Does Debt Bring?
Debt is a tool to help businesses grow, but if a business is incapable of paying off its lenders, then it exists at their mercy. If things get really bad, the lenders can take control of the business. While that is not too common, we often do see indebted companies permanently diluting shareholders because lenders force them to raise capital at a distressed price. Having said that, the most common situation is where a company manages its debt reasonably well - and to its own advantage. When we examine debt levels, we first consider both cash and debt levels, together.
See our latest analysis for Kewpie
How Much Debt Does Kewpie Carry?
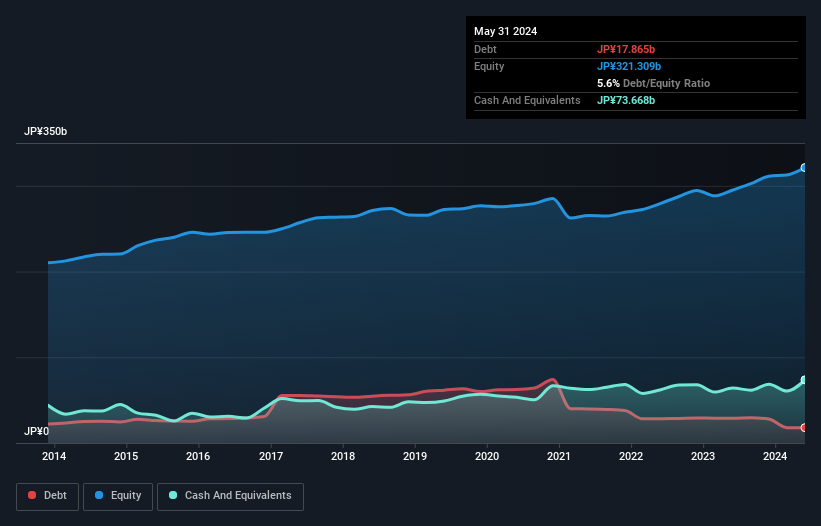
As you can see below, Kewpie had JP¥17.9b of debt at May 2024, down from JP¥28.9b a year prior. However, it does have JP¥73.7b in cash offsetting this, leading to net cash of JP¥55.8b.
How Healthy Is Kewpie's Balance Sheet?
The latest balance sheet data shows that Kewpie had liabilities of JP¥73.0b due within a year, and liabilities of JP¥38.3b falling due after that. Offsetting these obligations, it had cash of JP¥73.7b as well as receivables valued at JP¥65.6b due within 12 months. So it can boast JP¥28.0b more liquid assets than total liabilities.
This short term liquidity is a sign that Kewpie could probably pay off its debt with ease, as its balance sheet is far from stretched. Succinctly put, Kewpie boasts net cash, so it's fair to say it does not have a heavy debt load!
In addition to that, we're happy to report that Kewpie has boosted its EBIT by 74%, thus reducing the spectre of future debt repayments. When analysing debt levels, the balance sheet is the obvious place to start. But ultimately the future profitability of the business will decide if Kewpie can strengthen its balance sheet over time. So if you're focused on the future you can check out this free report showing analyst profit forecasts.
Finally, a business needs free cash flow to pay off debt; accounting profits just don't cut it. While Kewpie has net cash on its balance sheet, it's still worth taking a look at its ability to convert earnings before interest and tax (EBIT) to free cash flow, to help us understand how quickly it is building (or eroding) that cash balance. Over the most recent three years, Kewpie recorded free cash flow worth 64% of its EBIT, which is around normal, given free cash flow excludes interest and tax. This cold hard cash means it can reduce its debt when it wants to.
Summing Up
While we empathize with investors who find debt concerning, you should keep in mind that Kewpie has net cash of JP¥55.8b, as well as more liquid assets than liabilities. And we liked the look of last year's 74% year-on-year EBIT growth. So we don't think Kewpie's use of debt is risky. Above most other metrics, we think its important to track how fast earnings per share is growing, if at all. If you've also come to that realization, you're in luck, because today you can view this interactive graph of Kewpie's earnings per share history for free.
If you're interested in investing in businesses that can grow profits without the burden of debt, then check out this free list of growing businesses that have net cash on the balance sheet.
Valuation is complex, but we're here to simplify it.
Discover if Kewpie might be undervalued or overvalued with our detailed analysis, featuring fair value estimates, potential risks, dividends, insider trades, and its financial condition.
Access Free AnalysisHave feedback on this article? Concerned about the content? Get in touch with us directly. Alternatively, email editorial-team (at) simplywallst.com.
This article by Simply Wall St is general in nature. We provide commentary based on historical data and analyst forecasts only using an unbiased methodology and our articles are not intended to be financial advice. It does not constitute a recommendation to buy or sell any stock, and does not take account of your objectives, or your financial situation. We aim to bring you long-term focused analysis driven by fundamental data. Note that our analysis may not factor in the latest price-sensitive company announcements or qualitative material. Simply Wall St has no position in any stocks mentioned.
About TSE:2809
Kewpie
Through its subsidiaries, manufactures and sales food products in Japan and internationally.
Flawless balance sheet and undervalued.
Similar Companies
Market Insights

Community Narratives

