Asahi Group Holdings (TSE:2502) has seen its stock price dip around 1% following a week of modest declines. Investors are watching to see if recent trends signal a deeper correction or present a longer-term opportunity.
Zooming out, Asahi Group Holdings’ recent modest declines follow a year in which momentum has faded. The 1-year total shareholder return is slightly negative, and longer-term gains now appear more subdued. While some investors are growing cautious, others see valuations as catching up with fundamentals.
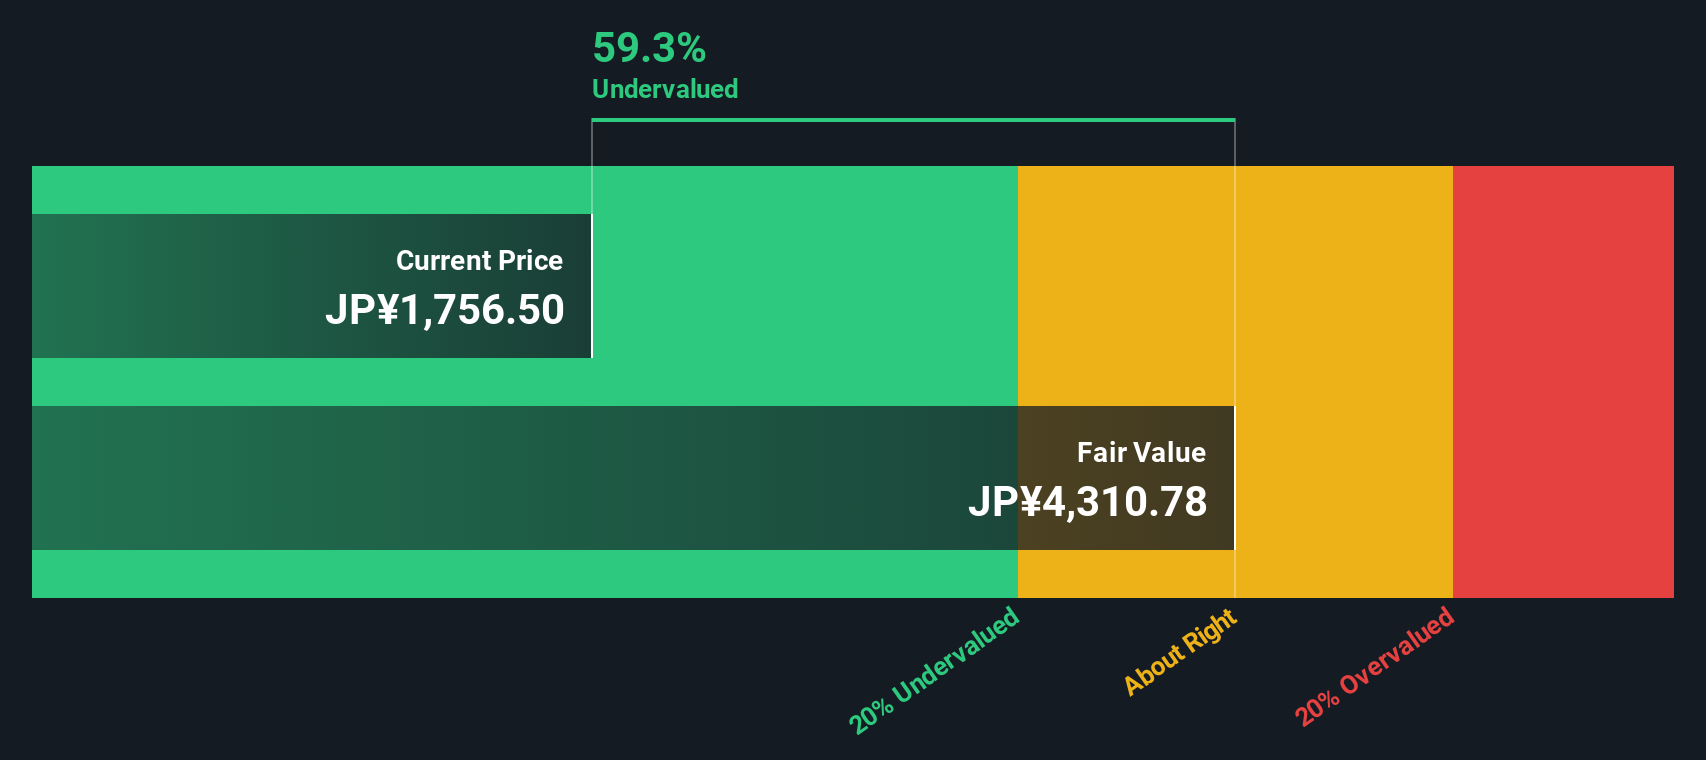
Asahi’s shares now trade at a significant discount to both analyst targets and some intrinsic value estimates. This raises the question: is this a prime entry point, or is the market simply reflecting slower future growth?
Advertisement
Price-to-Earnings of 14.7x: Is it justified?
Asahi Group Holdings is currently trading at a price-to-earnings (P/E) ratio of 14.7x, which is notably below both its industry average and the broader peer set. This suggests the market may be discounting the company’s near-term prospects or has yet to recognize its true earnings power.
The P/E ratio compares a company’s share price to its annual net earnings and serves as a gauge for how much investors are willing to pay per yen of profit. For established consumer staples like Asahi, the P/E often reflects expected growth, profitability, and perceived risk in a sector known for stable but moderate expansion.
When measured against the Asian Beverage industry average of 19.5x and a peer average of 55.3x, Asahi’s valuation appears potentially conservative. The current P/E is well below these benchmarks and also sits beneath the estimated fair P/E of 25.1x, which may indicate further room for market reassessment if growth and quality are sustained.
However, risks remain, including the potential for weaker revenue growth or market sentiment shifts. Either of these factors could challenge the current undervaluation thesis.
Looking at our DCF model provides a different perspective. On this measure, Asahi Group Holdings appears deeply undervalued, trading at a substantial 60% discount to its estimated intrinsic value. Could this gap signal a market oversight, or is there another risk beneath the surface?
If you have your own perspective or want to dig deeper into the numbers, you can craft your own view in just a few minutes. Do it your way
A great starting point for your Asahi Group Holdings research is our analysis highlighting 5 key rewards and 1 important warning sign that could impact your investment decision.
Looking for More Investment Ideas?
Don’t let opportunity pass you by. Uncover companies that match your goals, gain an informed edge, and make your next move count with these powerful tools:
Tap into potential high-growth technology leaders by using these 24 AI penny stocks. This allows you to position yourself at the forefront of innovation.
Capitalize on game-changing advances in computing by spotting tomorrow’s trailblazers inside these 26 quantum computing stocks for breakthrough opportunities.
This article by Simply Wall St is general in nature. We provide commentary based on historical data
and analyst forecasts only using an unbiased methodology and our articles are not intended to be financial advice. It does not constitute a recommendation to buy or sell any stock, and does not take account of your objectives, or your
financial situation. We aim to bring you long-term focused analysis driven by fundamental data.
Note that our analysis may not factor in the latest price-sensitive company announcements or qualitative material.
Simply Wall St has no position in any stocks mentioned.
New: Manage All Your Stock Portfolios in One Place
We've created the ultimate portfolio companion for stock investors, and it's free.
• Connect an unlimited number of Portfolios and see your total in one currency • Be alerted to new Warning Signs or Risks via email or mobile • Track the Fair Value of your stocks