- Japan
- /
- Oil and Gas
- /
- TSE:5010
What Nippon Seiro Co., Ltd.'s (TSE:5010) 26% Share Price Gain Is Not Telling You

Nippon Seiro Co., Ltd. (TSE:5010) shareholders are no doubt pleased to see that the share price has bounced 26% in the last month, although it is still struggling to make up recently lost ground. Looking back a bit further, it's encouraging to see the stock is up 84% in the last year.
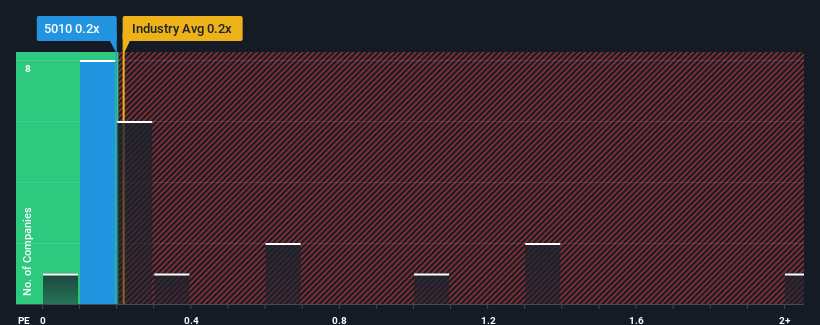
In spite of the firm bounce in price, it's still not a stretch to say that Nippon Seiro's price-to-sales (or "P/S") ratio of 0.2x right now seems quite "middle-of-the-road" compared to the Oil and Gas industry in Japan, seeing as it matches the P/S ratio of the wider industry. While this might not raise any eyebrows, if the P/S ratio is not justified investors could be missing out on a potential opportunity or ignoring looming disappointment.
See our latest analysis for Nippon Seiro
How Has Nippon Seiro Performed Recently?
For example, consider that Nippon Seiro's financial performance has been poor lately as its revenue has been in decline. It might be that many expect the company to put the disappointing revenue performance behind them over the coming period, which has kept the P/S from falling. If you like the company, you'd at least be hoping this is the case so that you could potentially pick up some stock while it's not quite in favour.
Although there are no analyst estimates available for Nippon Seiro, take a look at this free data-rich visualisation to see how the company stacks up on earnings, revenue and cash flow.Do Revenue Forecasts Match The P/S Ratio?
In order to justify its P/S ratio, Nippon Seiro would need to produce growth that's similar to the industry.
Retrospectively, the last year delivered a frustrating 38% decrease to the company's top line. This means it has also seen a slide in revenue over the longer-term as revenue is down 7.5% in total over the last three years. So unfortunately, we have to acknowledge that the company has not done a great job of growing revenue over that time.
Weighing that medium-term revenue trajectory against the broader industry's one-year forecast for expansion of 5.9% shows it's an unpleasant look.
With this information, we find it concerning that Nippon Seiro is trading at a fairly similar P/S compared to the industry. It seems most investors are ignoring the recent poor growth rate and are hoping for a turnaround in the company's business prospects. Only the boldest would assume these prices are sustainable as a continuation of recent revenue trends is likely to weigh on the share price eventually.
The Bottom Line On Nippon Seiro's P/S
Nippon Seiro appears to be back in favour with a solid price jump bringing its P/S back in line with other companies in the industry Typically, we'd caution against reading too much into price-to-sales ratios when settling on investment decisions, though it can reveal plenty about what other market participants think about the company.
The fact that Nippon Seiro currently trades at a P/S on par with the rest of the industry is surprising to us since its recent revenues have been in decline over the medium-term, all while the industry is set to grow. Even though it matches the industry, we're uncomfortable with the current P/S ratio, as this dismal revenue performance is unlikely to support a more positive sentiment for long. If recent medium-term revenue trends continue, it will place shareholders' investments at risk and potential investors in danger of paying an unnecessary premium.
You need to take note of risks, for example - Nippon Seiro has 3 warning signs (and 2 which shouldn't be ignored) we think you should know about.
If companies with solid past earnings growth is up your alley, you may wish to see this free collection of other companies with strong earnings growth and low P/E ratios.
If you're looking to trade Nippon Seiro, open an account with the lowest-cost platform trusted by professionals, Interactive Brokers.
With clients in over 200 countries and territories, and access to 160 markets, IBKR lets you trade stocks, options, futures, forex, bonds and funds from a single integrated account.
Enjoy no hidden fees, no account minimums, and FX conversion rates as low as 0.03%, far better than what most brokers offer.
Sponsored ContentValuation is complex, but we're here to simplify it.
Discover if Nippon Seiro might be undervalued or overvalued with our detailed analysis, featuring fair value estimates, potential risks, dividends, insider trades, and its financial condition.
Access Free AnalysisHave feedback on this article? Concerned about the content? Get in touch with us directly. Alternatively, email editorial-team (at) simplywallst.com.
This article by Simply Wall St is general in nature. We provide commentary based on historical data and analyst forecasts only using an unbiased methodology and our articles are not intended to be financial advice. It does not constitute a recommendation to buy or sell any stock, and does not take account of your objectives, or your financial situation. We aim to bring you long-term focused analysis driven by fundamental data. Note that our analysis may not factor in the latest price-sensitive company announcements or qualitative material. Simply Wall St has no position in any stocks mentioned.
Have feedback on this article? Concerned about the content? Get in touch with us directly. Alternatively, email editorial-team@simplywallst.com
About TSE:5010
Nippon Seiro
Manufactures, processes, and sells petroleum waxes, physically and chemically converted wax products, and fuel oil in Japan, North America, rest of Asia, and internationally.
Good value with acceptable track record.
Market Insights

Community Narratives

