
Advertisement
- Japan
- /
- Diversified Financial
- /
- TSE:9812
Improved Revenues Required Before T.O. Holdings CO.,LTD. (TSE:9812) Stock's 97% Jump Looks Justified

T.O. Holdings CO.,LTD. (TSE:9812) shares have had a really impressive month, gaining 97% after a shaky period beforehand. The last month tops off a massive increase of 163% in the last year.
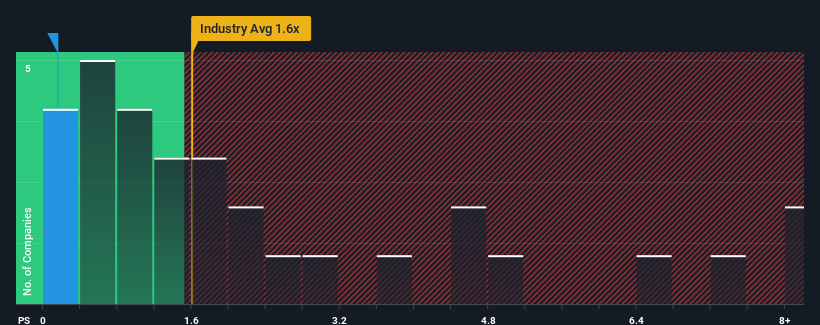
Even after such a large jump in price, T.O. HoldingsLTD may still be sending bullish signals at the moment with its price-to-sales (or "P/S") ratio of 0.2x, since almost half of all companies in the Diversified Financial industry in Japan have P/S ratios greater than 1.6x and even P/S higher than 5x are not unusual. Although, it's not wise to just take the P/S at face value as there may be an explanation why it's limited.
See our latest analysis for T.O. HoldingsLTD
How T.O. HoldingsLTD Has Been Performing
For instance, T.O. HoldingsLTD's receding revenue in recent times would have to be some food for thought. It might be that many expect the disappointing revenue performance to continue or accelerate, which has repressed the P/S. Those who are bullish on T.O. HoldingsLTD will be hoping that this isn't the case so that they can pick up the stock at a lower valuation.
Although there are no analyst estimates available for T.O. HoldingsLTD, take a look at this free data-rich visualisation to see how the company stacks up on earnings, revenue and cash flow.Do Revenue Forecasts Match The Low P/S Ratio?
There's an inherent assumption that a company should underperform the industry for P/S ratios like T.O. HoldingsLTD's to be considered reasonable.
Taking a look back first, the company's revenue growth last year wasn't something to get excited about as it posted a disappointing decline of 5.8%. This means it has also seen a slide in revenue over the longer-term as revenue is down 20% in total over the last three years. So unfortunately, we have to acknowledge that the company has not done a great job of growing revenue over that time.
Weighing that medium-term revenue trajectory against the broader industry's one-year forecast for expansion of 9.3% shows it's an unpleasant look.
With this information, we are not surprised that T.O. HoldingsLTD is trading at a P/S lower than the industry. However, we think shrinking revenues are unlikely to lead to a stable P/S over the longer term, which could set up shareholders for future disappointment. There's potential for the P/S to fall to even lower levels if the company doesn't improve its top-line growth.
What Does T.O. HoldingsLTD's P/S Mean For Investors?
The latest share price surge wasn't enough to lift T.O. HoldingsLTD's P/S close to the industry median. It's argued the price-to-sales ratio is an inferior measure of value within certain industries, but it can be a powerful business sentiment indicator.
It's no surprise that T.O. HoldingsLTD maintains its low P/S off the back of its sliding revenue over the medium-term. Right now shareholders are accepting the low P/S as they concede future revenue probably won't provide any pleasant surprises either. If recent medium-term revenue trends continue, it's hard to see the share price moving strongly in either direction in the near future under these circumstances.
Before you take the next step, you should know about the 2 warning signs for T.O. HoldingsLTD (1 is significant!) that we have uncovered.
If these risks are making you reconsider your opinion on T.O. HoldingsLTD, explore our interactive list of high quality stocks to get an idea of what else is out there.
Valuation is complex, but we're here to simplify it.
Discover if T.O. HoldingsLTD might be undervalued or overvalued with our detailed analysis, featuring fair value estimates, potential risks, dividends, insider trades, and its financial condition.
Access Free AnalysisHave feedback on this article? Concerned about the content? Get in touch with us directly. Alternatively, email editorial-team (at) simplywallst.com.
This article by Simply Wall St is general in nature. We provide commentary based on historical data and analyst forecasts only using an unbiased methodology and our articles are not intended to be financial advice. It does not constitute a recommendation to buy or sell any stock, and does not take account of your objectives, or your financial situation. We aim to bring you long-term focused analysis driven by fundamental data. Note that our analysis may not factor in the latest price-sensitive company announcements or qualitative material. Simply Wall St has no position in any stocks mentioned.
About TSE:9812
T.O. HoldingsLTD
T.O. Holdings Co.,Ltd., through its subsidiaries, engages in the distribution of clothing, furniture, home appliances, household appliances, mobile phone agency, and credit card business in Japan and internationally.
Slight with questionable track record.
Market Insights

Advertisement
Community Narratives
Pinterest will surge as advertising innovations ignite revenue growth
Fair Value US$42.63|27.0% undervalued
BR
Community Contributor
Brambles' Revenue Set to Climb 14% with Profit Margins Following
Fair Value AU$21.90|6.9% overvalued
RO
Community Contributor
Challenging Future for STG as Organic Sales Decline by 8.8%
Fair Value DKK 116.13|26.8% undervalued
KA
Community Contributor