Advertisement
- Japan
- /
- Diversified Financial
- /
- TSE:8729
Will Sony Financial Group’s Recent Price Slide Signal a Rebound Opportunity in 2025?

Simply Wall St
Reviewed by Bailey Pemberton
Thinking about what to do with Sony Financial Group stock? You are definitely not alone. Whether you have been holding on through thick and thin or are just now sizing up the opportunity, there is one thing that stands out about this stock right now: it is in the middle of a story most investors are just starting to notice. Sony Financial Group’s share price recently closed at 161.0, down 7.4% over the past week and, more strikingly, a massive 93.8% over the last five years. Market watchers attribute much of the recent volatility to ongoing sector shifts and changes in investor risk appetite. In fact, the stock’s latest movements have made more people question not just where the price is going next, but whether the current valuation truly reflects what the company is worth.
So, is Sony Financial Group on deep discount, or does that steep drop suggest trouble ahead? To answer that, it helps to look at how the company stacks up by multiple valuation checks. On a score of 0 to 6, where a point is added for each sign of undervaluation, the company gets a 3, right down the middle. That means it looks undervalued on literally half the standard measures analysts use. But, as always, the numbers only tell part of the story.
We will walk through the big valuation approaches next to see where Sony Financial Group stands and why, but stick around for a fresh framework at the end, one that cuts through the noise to help you decide what undervaluation really means for your investments.
Approach 1: Sony Financial Group Excess Returns Analysis
The Excess Returns model evaluates a company by looking beyond simple profits and instead focuses on how much return a business generates above its cost of equity. In other words, it measures whether Sony Financial Group is making enough from its investments to reward its shareholders more than the basic required return.
For Sony Financial Group, the numbers reveal some fundamental strengths. The company has a Book Value of ¥88.10 per share and a Stable Earnings Per Share (EPS) of ¥14.29, based on forecasts from four analysts. The cost to equity holders is ¥7.91 per share, so the business is delivering a notable Excess Return of ¥6.38 per share. Looking at profitability, the group’s average Return on Equity is a strong 10.41%, while the Stable Book Value is projected at ¥137.32 per share according to data from two analyst estimates.
Applying the Excess Returns approach, the model estimates that Sony Financial Group’s intrinsic value is ¥259.07 per share. With the current share price at ¥161.0, this implies the stock is trading at a 37.9% discount to what the model calculates as its fair value. By this measure, the shares are solidly undervalued.
Result: UNDERVALUED
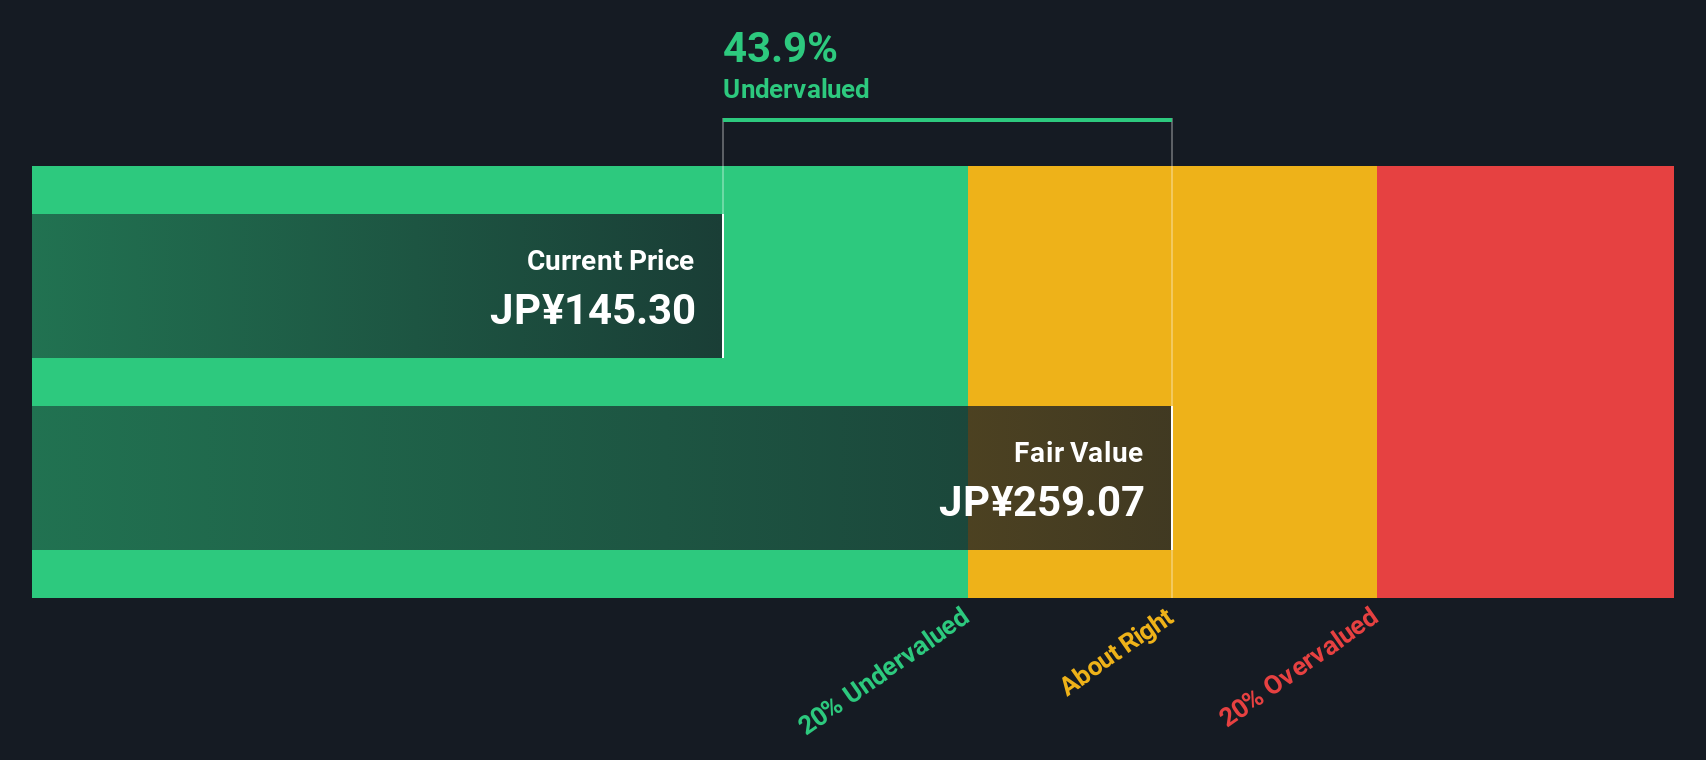
Our Excess Returns analysis suggests Sony Financial Group is undervalued by 37.9%. Track this in your watchlist or portfolio, or discover more undervalued stocks.
Approach 2: Sony Financial Group Price vs Earnings
When evaluating profitable companies, the Price-to-Earnings (PE) ratio is often the go-to valuation metric. The PE ratio helps investors understand how much they are paying for every unit of current profit, making it particularly useful for steady, earnings-generating businesses like Sony Financial Group.
Of course, deciding what makes a “fair” PE ratio depends on more than just profits. It is influenced by growth outlook, business risks, and how the company stacks up against its sector. Higher growth prospects typically justify a higher PE, while greater risk or market uncertainty warrants a discount.
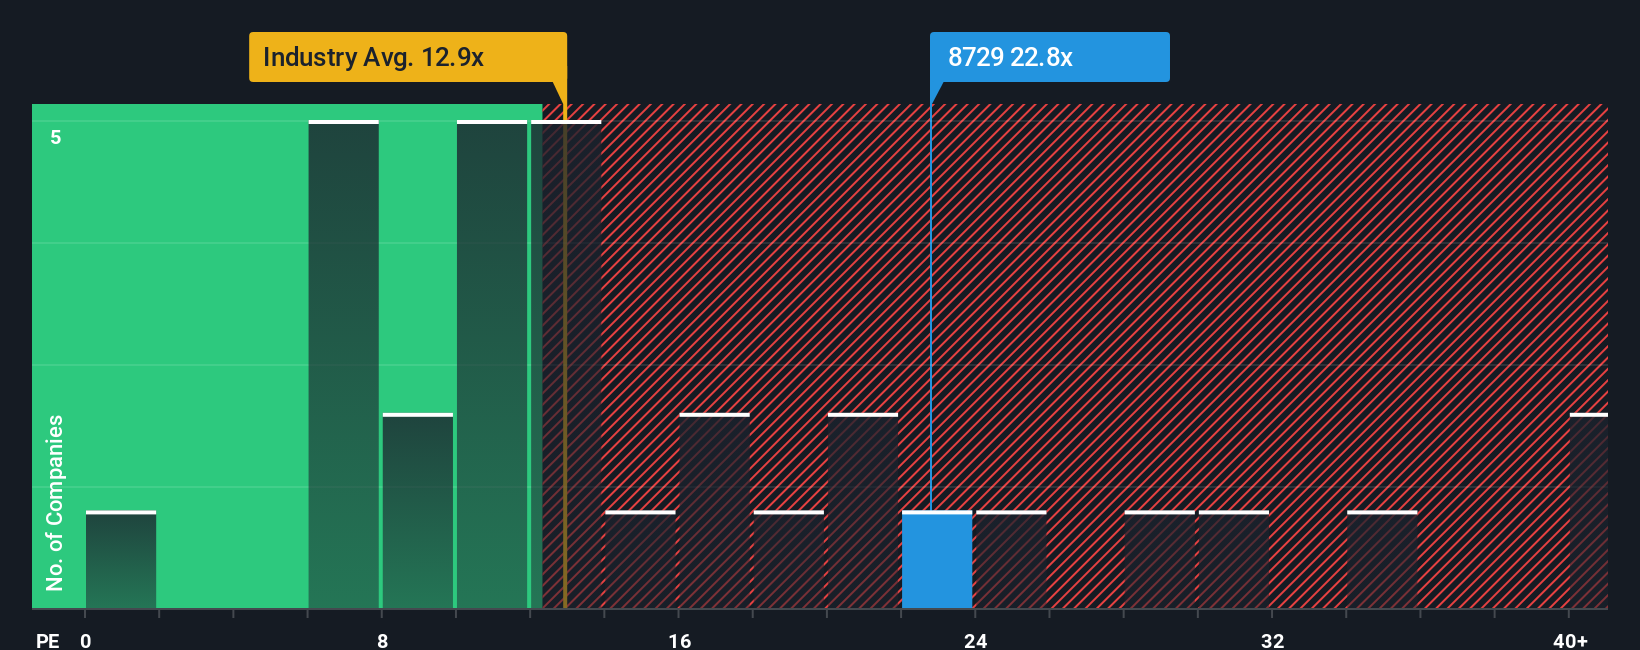
Right now, Sony Financial Group’s PE ratio stands at 23.8x. That is almost dead even with the peer group average of 24.9x, but noticeably above the Diversified Financial industry average of 12.6x. While these benchmarks provide context, they do not fully consider Sony Financial Group’s unique mix of earnings stability and risk profile.
Simply Wall St’s proprietary “Fair Ratio” bridges that gap by blending earnings growth, profit margins, sector trends, company size, and risk into a single expected multiple. Unlike basic peer or industry comparisons, the Fair Ratio adapts to the firm’s individual strengths and challenges. This approach offers a more tailored sense of value.
Comparing Sony Financial Group’s actual PE of 23.8x to its calculated Fair Ratio, the numbers are so close that the stock can be seen as appropriately priced in the market right now.
Result: ABOUT RIGHT
PE ratios tell one story, but what if the real opportunity lies elsewhere? Discover companies where insiders are betting big on explosive growth.
Upgrade Your Decision Making: Choose your Sony Financial Group Narrative
Earlier we mentioned that there is an even better way to understand valuation, so let’s introduce you to Narratives. A Narrative is simply your personal story or perspective on a company’s future. It connects the story you believe about a business with real numbers, like your fair value estimate and forecasts for revenue, earnings, and margins. Rather than just relying on ratios, Narratives help tie together Sony Financial Group’s unique story, your expectations for its future, and what you think its shares are really worth.
This approach is easy and accessible for everyone through the Simply Wall St platform, where millions of investors share and build Narratives in the Community page. Narratives let you see whether your view of fair value matches or differs from the current price, helping you decide when to buy or sell. In addition, they are updated automatically as new news or earnings are released, so your thinking adjusts with the market.
For example, one investor might see Sony Financial Group as significantly undervalued by forecasting a rapid return to profit growth, while another could believe the stock is still overpriced if they expect ongoing industry headwinds.
Do you think there's more to the story for Sony Financial Group? Create your own Narrative to let the Community know!
This article by Simply Wall St is general in nature. We provide commentary based on historical data and analyst forecasts only using an unbiased methodology and our articles are not intended to be financial advice. It does not constitute a recommendation to buy or sell any stock, and does not take account of your objectives, or your financial situation. We aim to bring you long-term focused analysis driven by fundamental data. Note that our analysis may not factor in the latest price-sensitive company announcements or qualitative material. Simply Wall St has no position in any stocks mentioned.
New: Manage All Your Stock Portfolios in One Place
We've created the ultimate portfolio companion for stock investors, and it's free.
• Connect an unlimited number of Portfolios and see your total in one currency
• Be alerted to new Warning Signs or Risks via email or mobile
• Track the Fair Value of your stocks
Have feedback on this article? Concerned about the content? Get in touch with us directly. Alternatively, email editorial-team@simplywallst.com
About TSE:8729
Fair value with moderate growth potential.
Market Insights

Advertisement
Community Narratives
The Next Phase of Energy Storage: How NeoVolta Is Tackling America’s Power Crunch
Fair Value US$7.50|35.1% undervalued
MA
Community Contributor
Why EnSilica is Worth Possibly 13x its Current Price
Fair Value UK£5.00|89.8% undervalued
DO
Community Contributor
M&A Activity, Industry Diversification & A Defense Contract Monopoly Will Push BWXT For Healthy Long-Term Growth
Fair Value US$220.00|15.2% undervalued
CL
Community Contributor
A case for Cassiar Gold Corp (TSXV: GLDC) to reach CAD$8-10 before 2030 (X30-37)
Fair Value CA$10.00|96.0% undervalued
AG
Community Contributor