Advertisement
- Japan
- /
- Diversified Financial
- /
- TSE:8729
Sony Financial Group (TSE:8729): Is the High P/E Ratio Justified by Future Value?

Simply Wall St
Reviewed by Kshitija Bhandaru
Sony Financial Group (TSE:8729) has drawn renewed attention after a stretch of muted share price movement. Investors are looking to its financial metrics and recent performance for signs of where the stock might head next.
See our latest analysis for Sony Financial Group.
While Sony Financial Group’s latest share price of ¥146.3 may not suggest fireworks, the bigger picture hints at a stock finding its footing after a period of gentle declines. The 5-year total shareholder return stands at -0.94%, which speaks to lukewarm long-term momentum. Recent days have shown signs of stability as investors weigh growth in net income against revenue contraction.
If you’re watching for other compelling moves this year, it’s the perfect moment to broaden your search and discover fast growing stocks with high insider ownership
But is Sony Financial Group actually trading below its true worth, or are investors already anticipating any future upside in the share price? Is there a real buying opportunity, or is growth already factored in?
Price-to-Earnings of 22x: Is it justified?
At a price-to-earnings ratio of 22x, Sony Financial Group is trading well above both the industry and peer averages, even as its share price remains subdued at ¥146.3.
The price-to-earnings (P/E) ratio measures how much investors are willing to pay for a company's earnings, making it a key tool for gauging valuation, especially in the financial sector. A higher P/E can reflect expectations for future profit growth, but may also signal potential overvaluation if growth prospects do not materialize.
Compared to the JP Diversified Financial industry average of 12.4x and a peer average of 11.9x, Sony Financial Group's P/E stands out as expensive. The market is assigning a premium to its current and future earnings relative to sector norms, which may not be justified if underlying growth lags or proves volatile. With a P/E this elevated, either future earnings need to accelerate meaningfully, or expectations could realign toward industry benchmarks.
See what the numbers say about this price — find out in our valuation breakdown.
Result: Price-to-Earnings of 22x (OVERVALUED)
However, revenue contraction and unclear short-term returns could challenge the positive outlook. This is especially true if growth in net income fails to sustain momentum.
Find out about the key risks to this Sony Financial Group narrative.
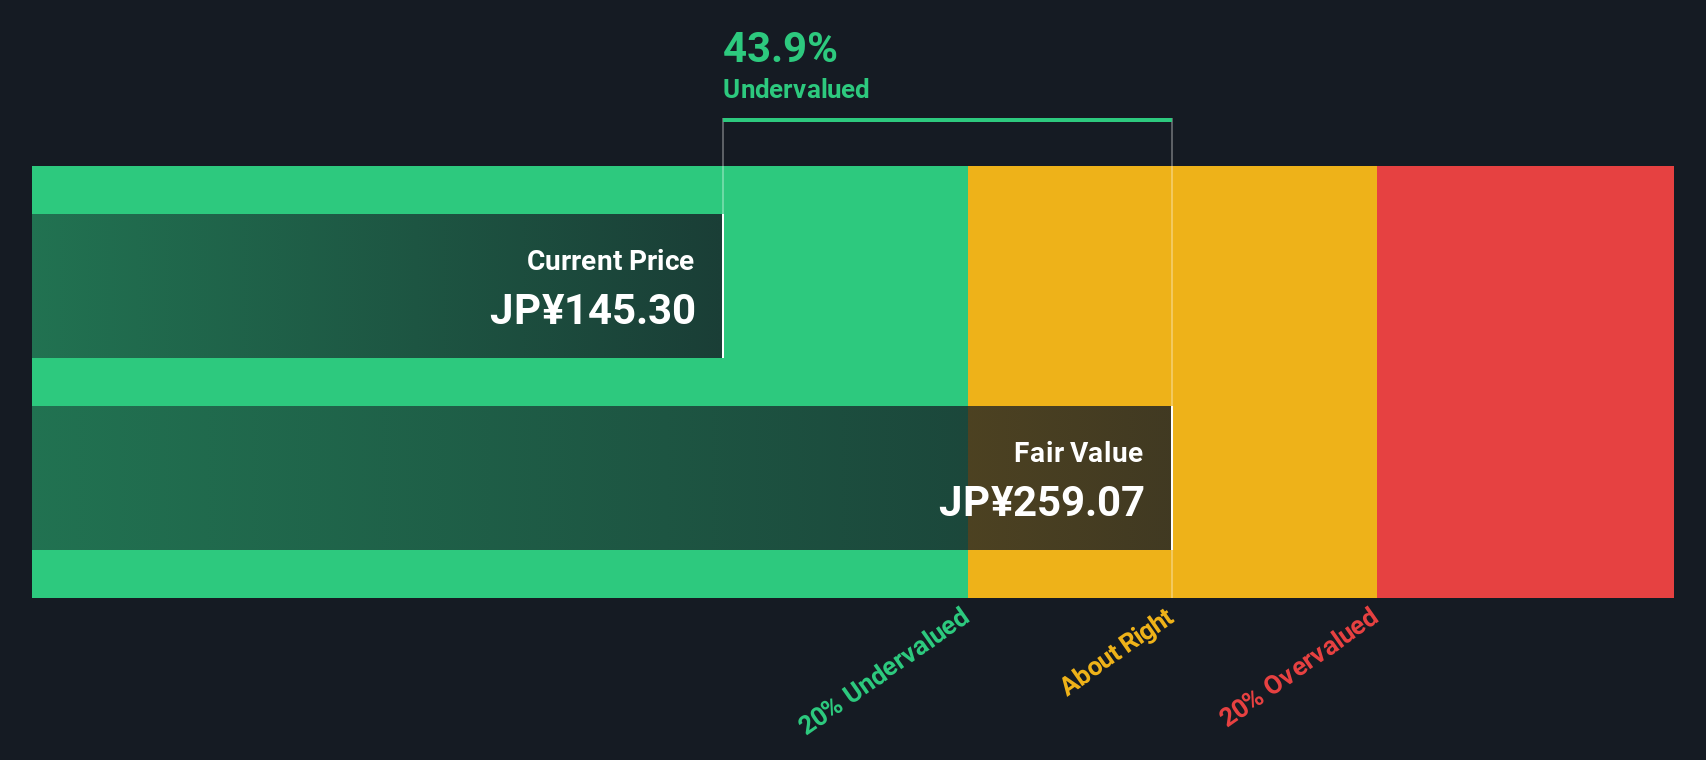
Another View: The SWS DCF Model
Looking at Sony Financial Group through the lens of our DCF model offers a completely different perspective. Despite the high earnings multiple highlighted earlier, the SWS DCF approach suggests the stock is actually undervalued and trading about 41% below its estimated fair value. Could this hidden potential be what the market is missing?
Look into how the SWS DCF model arrives at its fair value.
Simply Wall St performs a discounted cash flow (DCF) on every stock in the world every day (check out Sony Financial Group for example). We show the entire calculation in full. You can track the result in your watchlist or portfolio and be alerted when this changes, or use our stock screener to discover undervalued stocks based on their cash flows. If you save a screener we even alert you when new companies match - so you never miss a potential opportunity.
Build Your Own Sony Financial Group Narrative
If you’d rather take matters into your own hands or see a different angle in the numbers, you can build a personalized view of Sony Financial Group in just a few minutes. Do it your way
A great starting point for your Sony Financial Group research is our analysis highlighting 3 key rewards and 3 important warning signs that could impact your investment decision.
Looking for more investment ideas?
Don’t miss the edge that comes from considering new sectors and timely themes. Simply Wall Street’s screener makes it easy to find game-changing opportunities tailored to your investing goals.
- Capture potential high yields by checking out these 19 dividend stocks with yields > 3% with above-average payouts and robust fundamentals backing their success.
- Capitalize on the artificial intelligence boom and spot early movers by using these 24 AI penny stocks shaping tomorrow’s digital economy.
- Stay ahead of the curve by targeting these 909 undervalued stocks based on cash flows that offer attractive entry points and substantial upside according to cash flow analysis.
This article by Simply Wall St is general in nature. We provide commentary based on historical data and analyst forecasts only using an unbiased methodology and our articles are not intended to be financial advice. It does not constitute a recommendation to buy or sell any stock, and does not take account of your objectives, or your financial situation. We aim to bring you long-term focused analysis driven by fundamental data. Note that our analysis may not factor in the latest price-sensitive company announcements or qualitative material. Simply Wall St has no position in any stocks mentioned.
New: Manage All Your Stock Portfolios in One Place
We've created the ultimate portfolio companion for stock investors, and it's free.
• Connect an unlimited number of Portfolios and see your total in one currency
• Be alerted to new Warning Signs or Risks via email or mobile
• Track the Fair Value of your stocks
Have feedback on this article? Concerned about the content? Get in touch with us directly. Alternatively, email editorial-team@simplywallst.com
About TSE:8729
Fair value with moderate growth potential.
Market Insights

Advertisement
Community Narratives
The Next Phase of Energy Storage: How NeoVolta Is Tackling America’s Power Crunch
Fair Value US$7.50|35.2% undervalued
MA
Community Contributor
Why EnSilica is Worth Possibly 13x its Current Price
Fair Value UK£5.00|90.0% undervalued
DO
Community Contributor
M&A Activity, Industry Diversification & A Defense Contract Monopoly Will Push BWXT For Healthy Long-Term Growth
Fair Value US$220.00|15.6% undervalued
CL
Community Contributor
A case for Cassiar Gold Corp (TSXV: GLDC) to reach CAD$8-10 before 2030 (X30-37)
Fair Value CA$10.00|97.1% undervalued
AG
Community Contributor