- Japan
- /
- Capital Markets
- /
- TSE:7342
After Leaping 27% WealthNavi Inc. (TSE:7342) Shares Are Not Flying Under The Radar


WealthNavi Inc. (TSE:7342) shares have continued their recent momentum with a 27% gain in the last month alone. The last 30 days bring the annual gain to a very sharp 81%.
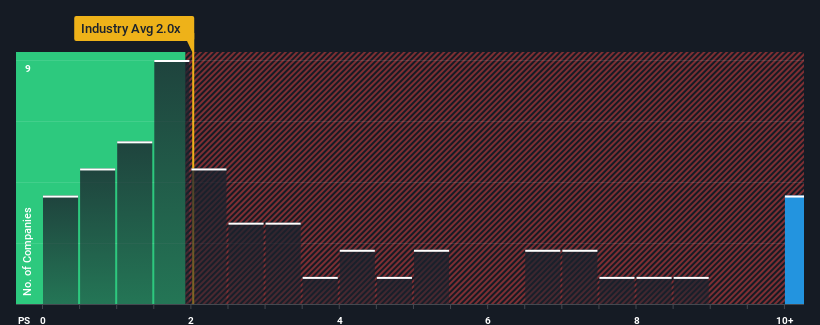
Following the firm bounce in price, when almost half of the companies in Japan's Capital Markets industry have price-to-sales ratios (or "P/S") below 2x, you may consider WealthNavi as a stock not worth researching with its 28.7x P/S ratio. However, the P/S might be quite high for a reason and it requires further investigation to determine if it's justified.
Check out our latest analysis for WealthNavi
How Has WealthNavi Performed Recently?
While the industry has experienced revenue growth lately, WealthNavi's revenue has gone into reverse gear, which is not great. One possibility is that the P/S ratio is high because investors think this poor revenue performance will turn the corner. You'd really hope so, otherwise you're paying a pretty hefty price for no particular reason.
Want the full picture on analyst estimates for the company? Then our free report on WealthNavi will help you uncover what's on the horizon.What Are Revenue Growth Metrics Telling Us About The High P/S?
There's an inherent assumption that a company should far outperform the industry for P/S ratios like WealthNavi's to be considered reasonable.
Taking a look back first, the company's revenue growth last year wasn't something to get excited about as it posted a disappointing decline of 41%. However, a few very strong years before that means that it was still able to grow revenue by an impressive 54% in total over the last three years. Although it's been a bumpy ride, it's still fair to say the revenue growth recently has been more than adequate for the company.
Looking ahead now, revenue is anticipated to climb by 62% each year during the coming three years according to the three analysts following the company. Meanwhile, the rest of the industry is forecast to only expand by 10% each year, which is noticeably less attractive.
With this information, we can see why WealthNavi is trading at such a high P/S compared to the industry. It seems most investors are expecting this strong future growth and are willing to pay more for the stock.
The Final Word
WealthNavi's P/S has grown nicely over the last month thanks to a handy boost in the share price. Using the price-to-sales ratio alone to determine if you should sell your stock isn't sensible, however it can be a practical guide to the company's future prospects.
As we suspected, our examination of WealthNavi's analyst forecasts revealed that its superior revenue outlook is contributing to its high P/S. It appears that shareholders are confident in the company's future revenues, which is propping up the P/S. Unless the analysts have really missed the mark, these strong revenue forecasts should keep the share price buoyant.
And what about other risks? Every company has them, and we've spotted 2 warning signs for WealthNavi (of which 1 is concerning!) you should know about.
Of course, profitable companies with a history of great earnings growth are generally safer bets. So you may wish to see this free collection of other companies that have reasonable P/E ratios and have grown earnings strongly.
If you're looking to trade WealthNavi, open an account with the lowest-cost platform trusted by professionals, Interactive Brokers.
With clients in over 200 countries and territories, and access to 160 markets, IBKR lets you trade stocks, options, futures, forex, bonds and funds from a single integrated account.
Enjoy no hidden fees, no account minimums, and FX conversion rates as low as 0.03%, far better than what most brokers offer.
Sponsored ContentValuation is complex, but we're here to simplify it.
Discover if WealthNavi might be undervalued or overvalued with our detailed analysis, featuring fair value estimates, potential risks, dividends, insider trades, and its financial condition.
Access Free AnalysisHave feedback on this article? Concerned about the content? Get in touch with us directly. Alternatively, email editorial-team (at) simplywallst.com.
This article by Simply Wall St is general in nature. We provide commentary based on historical data and analyst forecasts only using an unbiased methodology and our articles are not intended to be financial advice. It does not constitute a recommendation to buy or sell any stock, and does not take account of your objectives, or your financial situation. We aim to bring you long-term focused analysis driven by fundamental data. Note that our analysis may not factor in the latest price-sensitive company announcements or qualitative material. Simply Wall St has no position in any stocks mentioned.
About TSE:7342
WealthNavi
Develops and delivers an online asset management and risk management platform.
Excellent balance sheet with proven track record.
Market Insights

Community Narratives

