- Japan
- /
- Consumer Finance
- /
- TSE:6993
Daikokuya Holdings Co.,Ltd. (TSE:6993) Stock Catapults 27% Though Its Price And Business Still Lag The Industry


Daikokuya Holdings Co.,Ltd. (TSE:6993) shareholders would be excited to see that the share price has had a great month, posting a 27% gain and recovering from prior weakness. Unfortunately, the gains of the last month did little to right the losses of the last year with the stock still down 36% over that time.
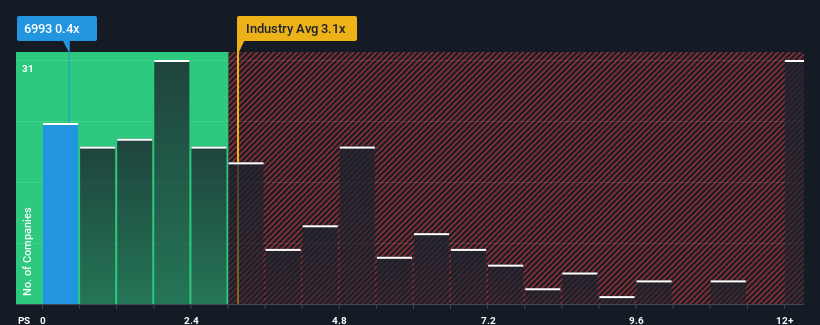
Although its price has surged higher, considering around half the companies operating in Japan's Consumer Finance industry have price-to-sales ratios (or "P/S") above 1.1x, you may still consider Daikokuya HoldingsLtd as an solid investment opportunity with its 0.4x P/S ratio. Although, it's not wise to just take the P/S at face value as there may be an explanation why it's limited.
See our latest analysis for Daikokuya HoldingsLtd
How Has Daikokuya HoldingsLtd Performed Recently?
As an illustration, revenue has deteriorated at Daikokuya HoldingsLtd over the last year, which is not ideal at all. It might be that many expect the disappointing revenue performance to continue or accelerate, which has repressed the P/S. Those who are bullish on Daikokuya HoldingsLtd will be hoping that this isn't the case so that they can pick up the stock at a lower valuation.
Although there are no analyst estimates available for Daikokuya HoldingsLtd, take a look at this free data-rich visualisation to see how the company stacks up on earnings, revenue and cash flow.Do Revenue Forecasts Match The Low P/S Ratio?
The only time you'd be truly comfortable seeing a P/S as low as Daikokuya HoldingsLtd's is when the company's growth is on track to lag the industry.
Taking a look back first, the company's revenue growth last year wasn't something to get excited about as it posted a disappointing decline of 12%. As a result, revenue from three years ago have also fallen 13% overall. Therefore, it's fair to say the revenue growth recently has been undesirable for the company.
In contrast to the company, the rest of the industry is expected to grow by 7.0% over the next year, which really puts the company's recent medium-term revenue decline into perspective.
With this information, we are not surprised that Daikokuya HoldingsLtd is trading at a P/S lower than the industry. However, we think shrinking revenues are unlikely to lead to a stable P/S over the longer term, which could set up shareholders for future disappointment. There's potential for the P/S to fall to even lower levels if the company doesn't improve its top-line growth.
What Does Daikokuya HoldingsLtd's P/S Mean For Investors?
The latest share price surge wasn't enough to lift Daikokuya HoldingsLtd's P/S close to the industry median. Using the price-to-sales ratio alone to determine if you should sell your stock isn't sensible, however it can be a practical guide to the company's future prospects.
It's no surprise that Daikokuya HoldingsLtd maintains its low P/S off the back of its sliding revenue over the medium-term. At this stage investors feel the potential for an improvement in revenue isn't great enough to justify a higher P/S ratio. Unless the recent medium-term conditions improve, they will continue to form a barrier for the share price around these levels.
Having said that, be aware Daikokuya HoldingsLtd is showing 3 warning signs in our investment analysis, and 1 of those is a bit unpleasant.
It's important to make sure you look for a great company, not just the first idea you come across. So if growing profitability aligns with your idea of a great company, take a peek at this free list of interesting companies with strong recent earnings growth (and a low P/E).
New: Manage All Your Stock Portfolios in One Place
We've created the ultimate portfolio companion for stock investors, and it's free.
• Connect an unlimited number of Portfolios and see your total in one currency
• Be alerted to new Warning Signs or Risks via email or mobile
• Track the Fair Value of your stocks
Have feedback on this article? Concerned about the content? Get in touch with us directly. Alternatively, email editorial-team (at) simplywallst.com.
This article by Simply Wall St is general in nature. We provide commentary based on historical data and analyst forecasts only using an unbiased methodology and our articles are not intended to be financial advice. It does not constitute a recommendation to buy or sell any stock, and does not take account of your objectives, or your financial situation. We aim to bring you long-term focused analysis driven by fundamental data. Note that our analysis may not factor in the latest price-sensitive company announcements or qualitative material. Simply Wall St has no position in any stocks mentioned.
Have feedback on this article? Concerned about the content? Get in touch with us directly. Alternatively, email editorial-team@simplywallst.com
About TSE:6993
Daikokuya HoldingsLtd
Operates electric and investment business in Japan.
Adequate balance sheet low.
Market Insights

Community Narratives


