- Japan
- /
- Diversified Financial
- /
- TSE:4073
Revenues Working Against Global Communication Planning Co.,Ltd.'s (TSE:4073) Share Price Following 26% Dive


The Global Communication Planning Co.,Ltd. (TSE:4073) share price has softened a substantial 26% over the previous 30 days, handing back much of the gains the stock has made lately. Still, a bad month hasn't completely ruined the past year with the stock gaining 39%, which is great even in a bull market.
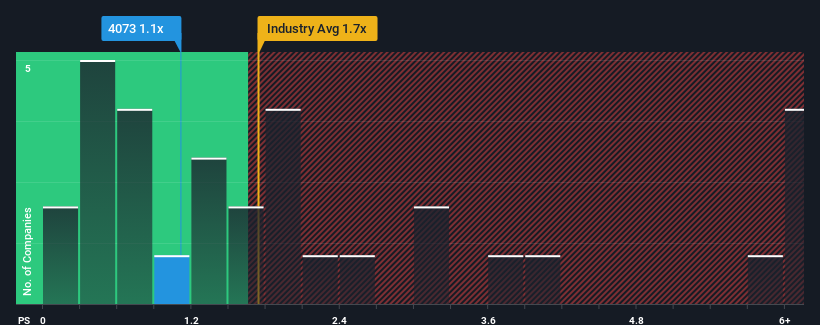
After such a large drop in price, Global Communication PlanningLtd may be sending bullish signals at the moment with its price-to-sales (or "P/S") ratio of 1.1x, since almost half of all companies in the Diversified Financial industry in Japan have P/S ratios greater than 1.7x and even P/S higher than 4x are not unusual. Although, it's not wise to just take the P/S at face value as there may be an explanation why it's limited.
See our latest analysis for Global Communication PlanningLtd
What Does Global Communication PlanningLtd's Recent Performance Look Like?
For example, consider that Global Communication PlanningLtd's financial performance has been poor lately as its revenue has been in decline. Perhaps the market believes the recent revenue performance isn't good enough to keep up the industry, causing the P/S ratio to suffer. Those who are bullish on Global Communication PlanningLtd will be hoping that this isn't the case so that they can pick up the stock at a lower valuation.
Although there are no analyst estimates available for Global Communication PlanningLtd, take a look at this free data-rich visualisation to see how the company stacks up on earnings, revenue and cash flow.How Is Global Communication PlanningLtd's Revenue Growth Trending?
Global Communication PlanningLtd's P/S ratio would be typical for a company that's only expected to deliver limited growth, and importantly, perform worse than the industry.
In reviewing the last year of financials, we were disheartened to see the company's revenues fell to the tune of 4.0%. The last three years don't look nice either as the company has shrunk revenue by 18% in aggregate. So unfortunately, we have to acknowledge that the company has not done a great job of growing revenue over that time.
In contrast to the company, the rest of the industry is expected to grow by 7.2% over the next year, which really puts the company's recent medium-term revenue decline into perspective.
With this in mind, we understand why Global Communication PlanningLtd's P/S is lower than most of its industry peers. Nonetheless, there's no guarantee the P/S has reached a floor yet with revenue going in reverse. There's potential for the P/S to fall to even lower levels if the company doesn't improve its top-line growth.
What Does Global Communication PlanningLtd's P/S Mean For Investors?
The southerly movements of Global Communication PlanningLtd's shares means its P/S is now sitting at a pretty low level. While the price-to-sales ratio shouldn't be the defining factor in whether you buy a stock or not, it's quite a capable barometer of revenue expectations.
Our examination of Global Communication PlanningLtd confirms that the company's shrinking revenue over the past medium-term is a key factor in its low price-to-sales ratio, given the industry is projected to grow. Right now shareholders are accepting the low P/S as they concede future revenue probably won't provide any pleasant surprises either. If recent medium-term revenue trends continue, it's hard to see the share price moving strongly in either direction in the near future under these circumstances.
Plus, you should also learn about these 3 warning signs we've spotted with Global Communication PlanningLtd (including 2 which are a bit concerning).
If strong companies turning a profit tickle your fancy, then you'll want to check out this free list of interesting companies that trade on a low P/E (but have proven they can grow earnings).
If you're looking to trade Global Communication PlanningLtd, open an account with the lowest-cost platform trusted by professionals, Interactive Brokers.
With clients in over 200 countries and territories, and access to 160 markets, IBKR lets you trade stocks, options, futures, forex, bonds and funds from a single integrated account.
Enjoy no hidden fees, no account minimums, and FX conversion rates as low as 0.03%, far better than what most brokers offer.
Sponsored ContentNew: Manage All Your Stock Portfolios in One Place
We've created the ultimate portfolio companion for stock investors, and it's free.
• Connect an unlimited number of Portfolios and see your total in one currency
• Be alerted to new Warning Signs or Risks via email or mobile
• Track the Fair Value of your stocks
Have feedback on this article? Concerned about the content? Get in touch with us directly. Alternatively, email editorial-team (at) simplywallst.com.
This article by Simply Wall St is general in nature. We provide commentary based on historical data and analyst forecasts only using an unbiased methodology and our articles are not intended to be financial advice. It does not constitute a recommendation to buy or sell any stock, and does not take account of your objectives, or your financial situation. We aim to bring you long-term focused analysis driven by fundamental data. Note that our analysis may not factor in the latest price-sensitive company announcements or qualitative material. Simply Wall St has no position in any stocks mentioned.
Have feedback on this article? Concerned about the content? Get in touch with us directly. Alternatively, email editorial-team@simplywallst.com
About TSE:4073
Slight and slightly overvalued.
Market Insights

Community Narratives

