Advertisement
- Japan
- /
- Hospitality
- /
- TSE:9861
Yoshinoya Holdings (TSE:9861) Valuation in Focus Following Dividend Policy Review

Simply Wall St
Reviewed by Kshitija Bhandaru
Yoshinoya Holdings (TSE:9861) held a board meeting to consider raising its interim dividend and revising its dividend forecast. Changes in dividend policy like these can directly influence shareholder returns and broader market expectations.
See our latest analysis for Yoshinoya Holdings.
Investors responded quickly to Yoshinoya Holdings' announcement about reviewing its interim dividend, supporting a positive 2.15% share price return over the past week. While momentum is still stabilizing after a 9% dip over the last quarter, the company stands out with a solid 63% total shareholder return for those who stuck around over the past five years.
If Yoshinoya’s evolving dividend policy has you interested in broader opportunities, this could be a great moment to discover fast growing stocks with high insider ownership.
With the company’s dividend policy under review and recent share price fluctuations, the key question for investors is whether Yoshinoya Holdings is undervalued at current levels or if the market has already anticipated future gains.
Price-to-Earnings of 51x: Is it justified?
Yoshinoya Holdings is trading at a price-to-earnings (P/E) ratio of 51x, which is significantly higher than both its peers and the industry average. With a last close price of ¥3,044, the stock stands well above the levels at which similar companies are valued.
The price-to-earnings ratio reflects how much investors are willing to pay today for each yen of the company's earnings. For companies in the hospitality sector, a high P/E can sometimes be justified by strong growth expectations. However, it can also indicate over-optimism if profit expansion does not keep pace.
Compared to peers, Yoshinoya's P/E of 51x is sharply above the peer average of 29.9x and the Japan Hospitality industry average of 24.2x. This means the market is pricing in much higher expectations for future earnings than for comparable companies. Meanwhile, the estimated fair P/E for Yoshinoya is 26.5x, suggesting the current premium may not be sustainable unless the company delivers substantial profit growth in the coming years. The current level stands as a high bar the company would need to clear to justify this valuation.
Explore the SWS fair ratio for Yoshinoya Holdings
Result: Price-to-Earnings of 51x (OVERVALUED)
However, unexpected drops in revenue growth or a failure to meet earnings expectations could quickly shift sentiment and challenge the current valuation narrative.
Find out about the key risks to this Yoshinoya Holdings narrative.
Another View: What Does the SWS DCF Model Say?
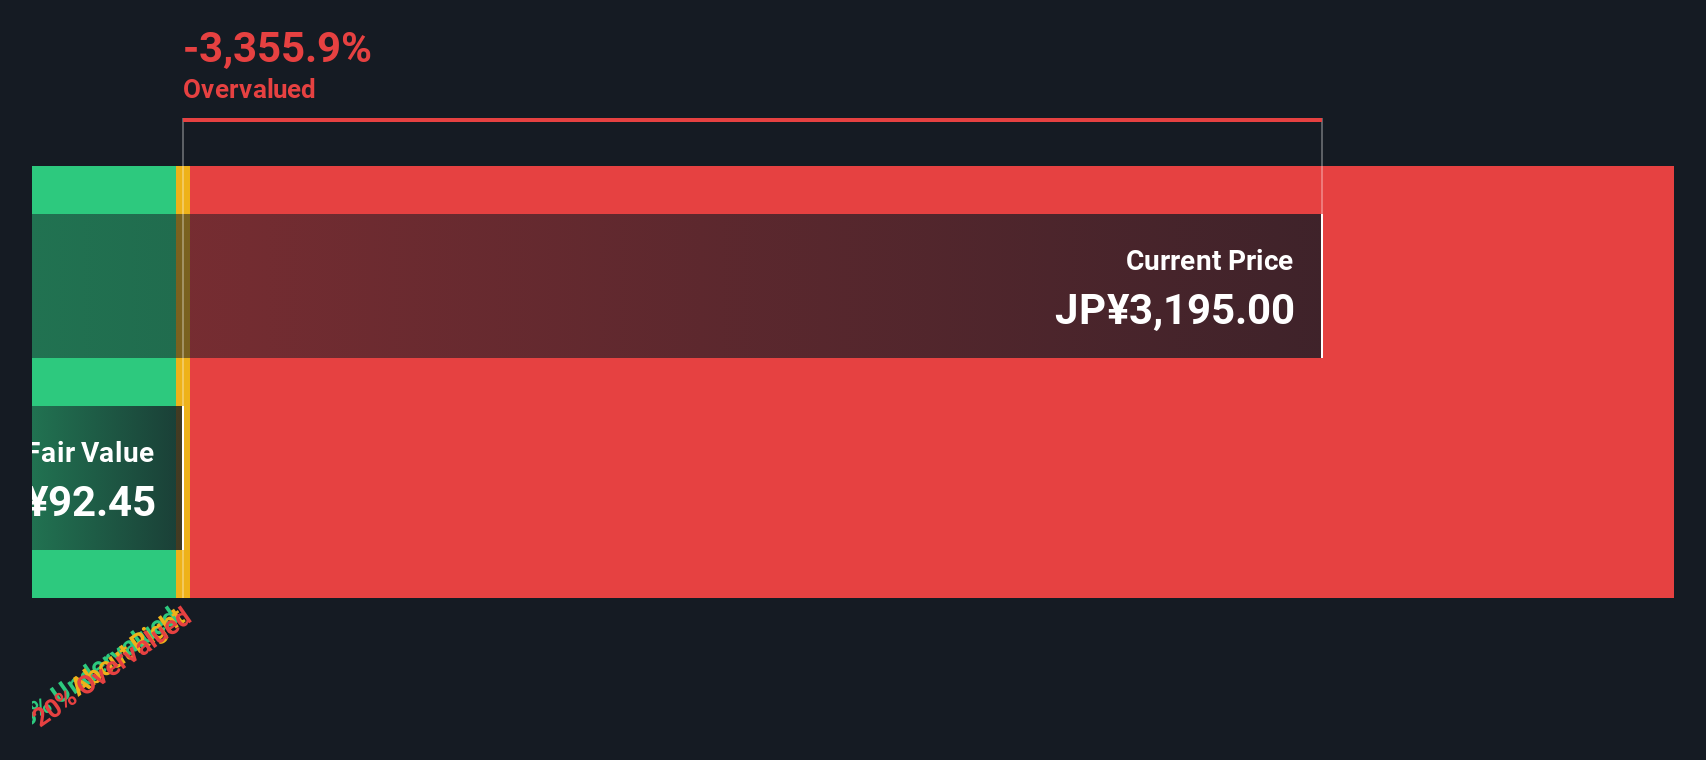
Taking another approach, our SWS DCF model suggests an even starker picture. The current price of ¥3,044 is significantly above the estimated fair value of ¥807.93, meaning the stock is overvalued according to this long-term cash flow model. Could the market be far too optimistic, or might growth catch up?
Look into how the SWS DCF model arrives at its fair value.
Simply Wall St performs a discounted cash flow (DCF) on every stock in the world every day (check out Yoshinoya Holdings for example). We show the entire calculation in full. You can track the result in your watchlist or portfolio and be alerted when this changes, or use our stock screener to discover undervalued stocks based on their cash flows. If you save a screener we even alert you when new companies match - so you never miss a potential opportunity.
Build Your Own Yoshinoya Holdings Narrative
If you see things differently or want to dig into the details yourself, you can explore the data and build your own take in just a few minutes with Do it your way.
A great starting point for your Yoshinoya Holdings research is our analysis highlighting 1 key reward and 1 important warning sign that could impact your investment decision.
Looking for more investment ideas?
Don’t limit yourself to just one opportunity. The market is full of smart moves waiting for you, and Simply Wall Street’s handpicked screeners highlight what’s really worth your attention.
- Unlock reliable income by reviewing high-yield opportunities now with these 18 dividend stocks with yields > 3% and tap into the power of strong dividend stocks.
- Spot the potential of tomorrow by checking out these 25 AI penny stocks leading innovation in the booming world of artificial intelligence.
- Turbocharge your portfolio with these 891 undervalued stocks based on cash flows, showing businesses trading below intrinsic value and ready for your next great investment play.
This article by Simply Wall St is general in nature. We provide commentary based on historical data and analyst forecasts only using an unbiased methodology and our articles are not intended to be financial advice. It does not constitute a recommendation to buy or sell any stock, and does not take account of your objectives, or your financial situation. We aim to bring you long-term focused analysis driven by fundamental data. Note that our analysis may not factor in the latest price-sensitive company announcements or qualitative material. Simply Wall St has no position in any stocks mentioned.
New: Manage All Your Stock Portfolios in One Place
We've created the ultimate portfolio companion for stock investors, and it's free.
• Connect an unlimited number of Portfolios and see your total in one currency
• Be alerted to new Warning Signs or Risks via email or mobile
• Track the Fair Value of your stocks
Have feedback on this article? Concerned about the content? Get in touch with us directly. Alternatively, email editorial-team@simplywallst.com
About TSE:9861
Yoshinoya Holdings
Through its subsidiaries, owns and operates restaurants in Japan and internationally.
Flawless balance sheet with moderate growth potential.
Similar Companies
Market Insights

Advertisement
Community Narratives
Kodiak AI - a potential 100 bagger opportunity?
Fair Value US$14.00|44.7% undervalued
DA
Community Contributor
A Fair Price for a Great Business Facing Real Threats
Fair Value US$383.06|13.0% undervalued
IM
Community Contributor
AXON And Shopify Integration Will Unlock Global Mobile Advertising
Fair Value US$646.30|0% overvalued
AN
Based on Analyst Price Targets