
Advertisement
- Japan
- /
- Hospitality
- /
- TSE:7581
Here's What To Make Of SaizeriyaLtd's (TSE:7581) Decelerating Rates Of Return
There are a few key trends to look for if we want to identify the next multi-bagger. Amongst other things, we'll want to see two things; firstly, a growing return on capital employed (ROCE) and secondly, an expansion in the company's amount of capital employed. Basically this means that a company has profitable initiatives that it can continue to reinvest in, which is a trait of a compounding machine. With that in mind, the ROCE of SaizeriyaLtd (TSE:7581) looks decent, right now, so lets see what the trend of returns can tell us.
What Is Return On Capital Employed (ROCE)?
Just to clarify if you're unsure, ROCE is a metric for evaluating how much pre-tax income (in percentage terms) a company earns on the capital invested in its business. To calculate this metric for SaizeriyaLtd, this is the formula:
Return on Capital Employed = Earnings Before Interest and Tax (EBIT) ÷ (Total Assets - Current Liabilities)
0.10 = JP¥12b ÷ (JP¥158b - JP¥40b) (Based on the trailing twelve months to February 2024).
Therefore, SaizeriyaLtd has an ROCE of 10%. That's a pretty standard return and it's in line with the industry average of 9.7%.
See our latest analysis for SaizeriyaLtd
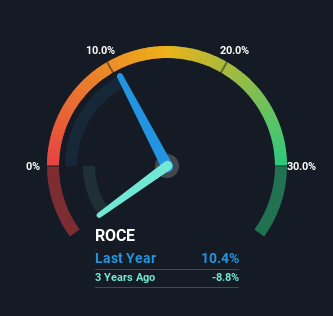
Above you can see how the current ROCE for SaizeriyaLtd compares to its prior returns on capital, but there's only so much you can tell from the past. If you're interested, you can view the analysts predictions in our free analyst report for SaizeriyaLtd .
What Can We Tell From SaizeriyaLtd's ROCE Trend?
While the current returns on capital are decent, they haven't changed much. The company has employed 31% more capital in the last five years, and the returns on that capital have remained stable at 10%. 10% is a pretty standard return, and it provides some comfort knowing that SaizeriyaLtd has consistently earned this amount. Stable returns in this ballpark can be unexciting, but if they can be maintained over the long run, they often provide nice rewards to shareholders.
On another note, while the change in ROCE trend might not scream for attention, it's interesting that the current liabilities have actually gone up over the last five years. This is intriguing because if current liabilities hadn't increased to 25% of total assets, this reported ROCE would probably be less than10% because total capital employed would be higher.The 10% ROCE could be even lower if current liabilities weren't 25% of total assets, because the the formula would show a larger base of total capital employed. With that in mind, just be wary if this ratio increases in the future, because if it gets particularly high, this brings with it some new elements of risk.
In Conclusion...
To sum it up, SaizeriyaLtd has simply been reinvesting capital steadily, at those decent rates of return. And the stock has done incredibly well with a 129% return over the last five years, so long term investors are no doubt ecstatic with that result. So while the positive underlying trends may be accounted for by investors, we still think this stock is worth looking into further.
While SaizeriyaLtd doesn't shine too bright in this respect, it's still worth seeing if the company is trading at attractive prices. You can find that out with our FREE intrinsic value estimation for 7581 on our platform.
If you want to search for solid companies with great earnings, check out this free list of companies with good balance sheets and impressive returns on equity.
New: Manage All Your Stock Portfolios in One Place
We've created the ultimate portfolio companion for stock investors, and it's free.
• Connect an unlimited number of Portfolios and see your total in one currency
• Be alerted to new Warning Signs or Risks via email or mobile
• Track the Fair Value of your stocks
Have feedback on this article? Concerned about the content? Get in touch with us directly. Alternatively, email editorial-team (at) simplywallst.com.
This article by Simply Wall St is general in nature. We provide commentary based on historical data and analyst forecasts only using an unbiased methodology and our articles are not intended to be financial advice. It does not constitute a recommendation to buy or sell any stock, and does not take account of your objectives, or your financial situation. We aim to bring you long-term focused analysis driven by fundamental data. Note that our analysis may not factor in the latest price-sensitive company announcements or qualitative material. Simply Wall St has no position in any stocks mentioned.
About TSE:7581
Flawless balance sheet with proven track record.
Similar Companies
Market Insights

Advertisement
Community Narratives
MINISO's fair value is projected at 26.69 with an anticipated PE ratio shift of 20x
Fair Value US$24.03|9.0% undervalued
BE
Community Contributor
Procter & Gamble: A Dividend Giant Facing Slowing Growth
Fair Value US$119.81|23.5% overvalued
AN
Community Contributor
Eli Lilly's Future Growth Driven by Tirzepatide and Favorable Market Conditions
Fair Value US$1.19k|14.4% undervalued
EA
Community Contributor