- Japan
- /
- Food and Staples Retail
- /
- TSE:8279
YaokoLtd's (TSE:8279) 9.0% CAGR outpaced the company's earnings growth over the same five-year period


If you buy and hold a stock for many years, you'd hope to be making a profit. Furthermore, you'd generally like to see the share price rise faster than the market. Unfortunately for shareholders, while the Yaoko Co.,Ltd. (TSE:8279) share price is up 45% in the last five years, that's less than the market return. Looking at the last year alone, the stock is up 14%.
The past week has proven to be lucrative for YaokoLtd investors, so let's see if fundamentals drove the company's five-year performance.
We check all companies for important risks. See what we found for YaokoLtd in our free report.To quote Buffett, 'Ships will sail around the world but the Flat Earth Society will flourish. There will continue to be wide discrepancies between price and value in the marketplace...' By comparing earnings per share (EPS) and share price changes over time, we can get a feel for how investor attitudes to a company have morphed over time.
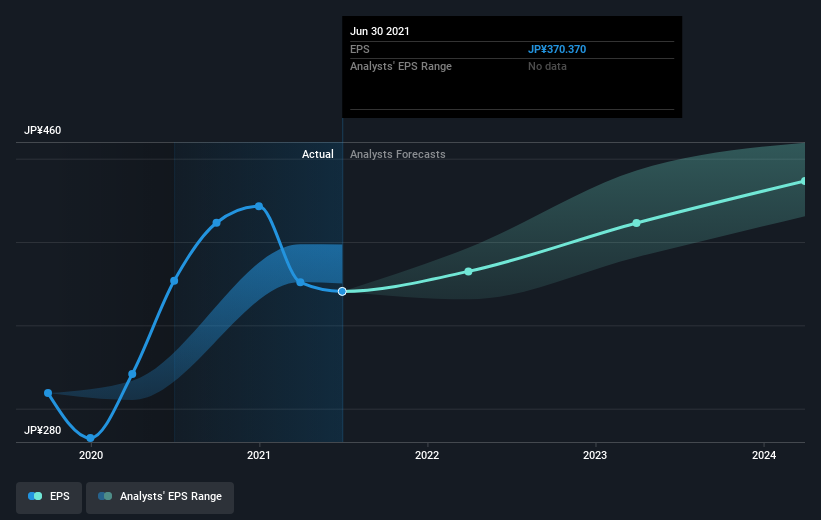
Over half a decade, YaokoLtd managed to grow its earnings per share at 11% a year. This EPS growth is higher than the 8% average annual increase in the share price. So one could conclude that the broader market has become more cautious towards the stock.
The image below shows how EPS has tracked over time (if you click on the image you can see greater detail).
Dive deeper into YaokoLtd's key metrics by checking this interactive graph of YaokoLtd's earnings, revenue and cash flow.
What About Dividends?
When looking at investment returns, it is important to consider the difference between total shareholder return (TSR) and share price return. The TSR is a return calculation that accounts for the value of cash dividends (assuming that any dividend received was reinvested) and the calculated value of any discounted capital raisings and spin-offs. So for companies that pay a generous dividend, the TSR is often a lot higher than the share price return. We note that for YaokoLtd the TSR over the last 5 years was 54%, which is better than the share price return mentioned above. And there's no prize for guessing that the dividend payments largely explain the divergence!
A Different Perspective
It's nice to see that YaokoLtd shareholders have received a total shareholder return of 16% over the last year. That's including the dividend. Since the one-year TSR is better than the five-year TSR (the latter coming in at 9% per year), it would seem that the stock's performance has improved in recent times. In the best case scenario, this may hint at some real business momentum, implying that now could be a great time to delve deeper. Before forming an opinion on YaokoLtd you might want to consider these 3 valuation metrics.
If you would prefer to check out another company -- one with potentially superior financials -- then do not miss this free list of companies that have proven they can grow earnings.
Please note, the market returns quoted in this article reflect the market weighted average returns of stocks that currently trade on Japanese exchanges.
If you're looking to trade YaokoLtd, open an account with the lowest-cost platform trusted by professionals, Interactive Brokers.
With clients in over 200 countries and territories, and access to 160 markets, IBKR lets you trade stocks, options, futures, forex, bonds and funds from a single integrated account.
Enjoy no hidden fees, no account minimums, and FX conversion rates as low as 0.03%, far better than what most brokers offer.
Sponsored ContentNew: Manage All Your Stock Portfolios in One Place
We've created the ultimate portfolio companion for stock investors, and it's free.
• Connect an unlimited number of Portfolios and see your total in one currency
• Be alerted to new Warning Signs or Risks via email or mobile
• Track the Fair Value of your stocks
Have feedback on this article? Concerned about the content? Get in touch with us directly. Alternatively, email editorial-team (at) simplywallst.com.
This article by Simply Wall St is general in nature. We provide commentary based on historical data and analyst forecasts only using an unbiased methodology and our articles are not intended to be financial advice. It does not constitute a recommendation to buy or sell any stock, and does not take account of your objectives, or your financial situation. We aim to bring you long-term focused analysis driven by fundamental data. Note that our analysis may not factor in the latest price-sensitive company announcements or qualitative material. Simply Wall St has no position in any stocks mentioned.
About TSE:8279
Flawless balance sheet with moderate growth potential.
Market Insights

Community Narratives

